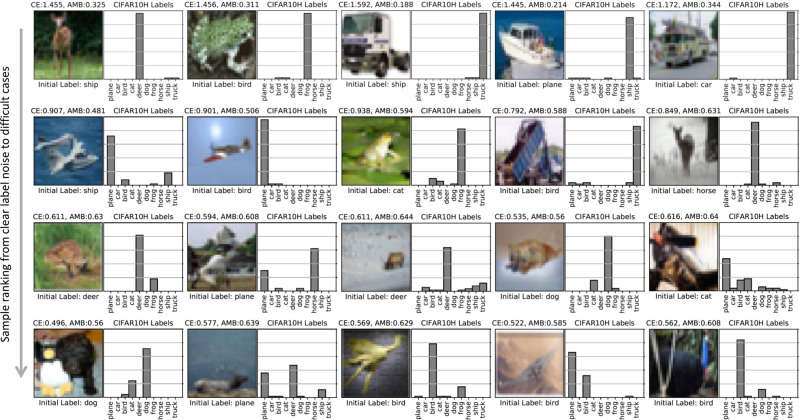
Fig. 4. Ranking of CIFAR10H samples (15% initial noise rate) by the SSL-Linear algorithm.
The top row illustrates a representative subset of images ranked at the top-10 percentile with the highest priority for relabelling. Similarly, the second and third rows correspond to 25–50 and 50–75 percentiles, respectively. At the bottom, ambiguous examples that fall into the bottom 10% of the list (N = 2241) are shown. Each example is shown together with its true label distribution to highlight the associated labelling difficulty. This can be compared against the label noisiness (cross-entropy; CE) and sample ambiguity (entropy; AMB) scores predicted by the algorithm (see Eq. (2)), shown above each image. As pointed out earlier, adjudication of samples provided at the bottom does require a large number of re-annotations to form a consensus. The authors in ref. 26 explore the causes of ambiguity observed in these samples.

