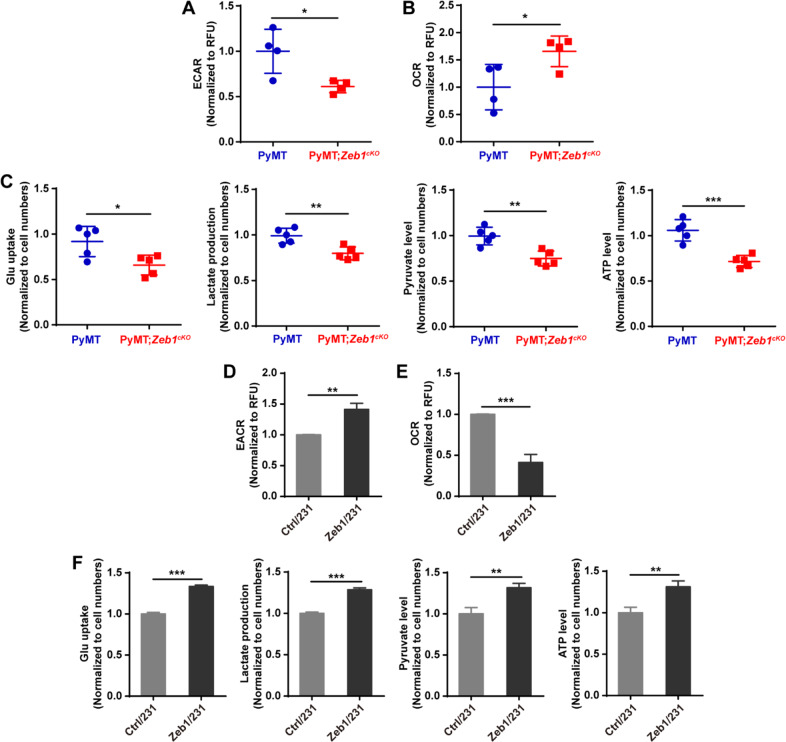
Fig. 2. Ectopic Zeb1 induces aerobic glycolysis.
A, B The alternations in (A) ECAR and (B) OCR in PyMT and PyMT;Zeb1cKO cells (n = 5). C The alternations in glucose uptake, pyruvate level, lactate production, and ATP level in PyMT and PyMT;Zeb1cKO cells (n = 5). D, E The alternations in (D) ECAR and (E) OCR in Ctrl/231 and Zeb1/231 cells. F The alternations in glucose uptake, pyruvate level, lactate production, and ATP level in Ctrl/231 and Zeb1/231 cells. Dots depict individual samples in (A–C). Data are representative of five (A–C) or three (D–F) independent experiments and presented as mean ± SEM. *P < 0.05, **P < 0.01, ***P < 0.001 vs the respective control by an unpaired Student’s t-test.

