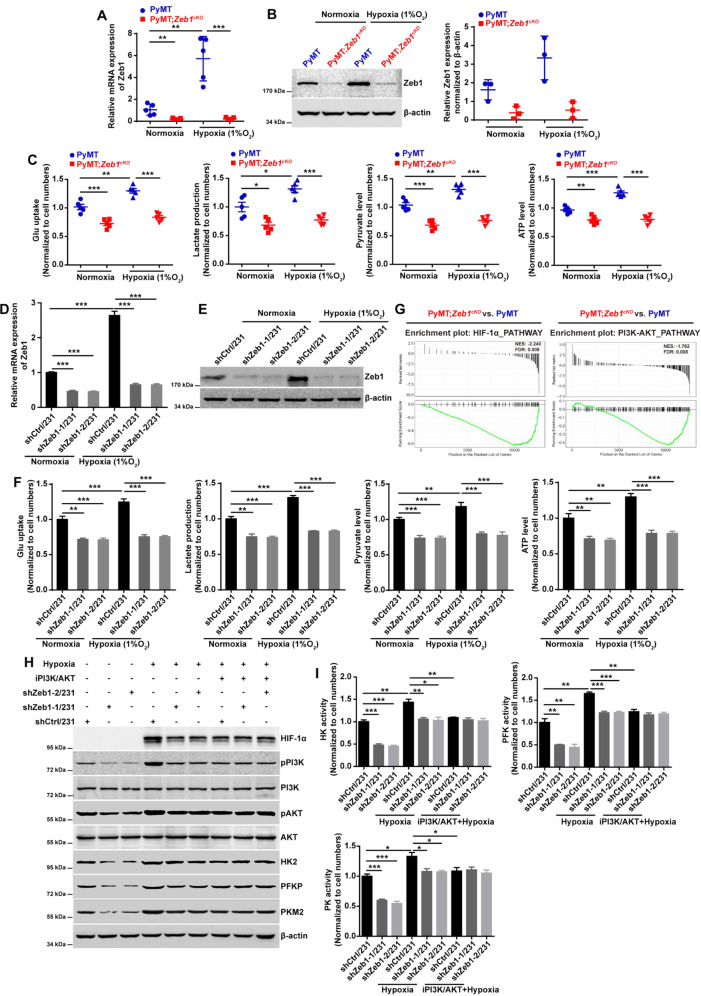
Fig. 4. Zeb1 regulates aerobic glycolysis under hypoxia.
A, B The relative (A) mRNA and (B) protein levels of Zeb1 in PyMT and PyMT;Zeb1cKO cells under normoxic and hypoxic conditions. C The alternations in glucose uptake, pyruvate level, lactate production, and ATP level in PyMT and PyMT;Zeb1cKO cells under normoxic and hypoxic conditions. D, E The relative (D) mRNA and (E) protein levels of Zeb1 in scramble shRNA-transfected (shCtrl/231) and Zeb1-specific shRNA-transfected (shZeb1/231) MDA-MB-231 cells under normoxic and hypoxic conditions. F The alternations in glucose uptake, pyruvate level, lactate production, and ATP level in shCtrl/231 and shZeb1/231 cells under normoxic and hypoxic conditions. G GSEA for transcriptome data from PyMT;Zeb1cKO vs PyMT cells revealing enrichment of a gene signature associated with reduced HIF-1α and PI3K-Akt signaling pathway activities in PyMT;Zeb1cKO breast cancer cells. NES, normalized enrichment score; FDR, false discovery rate. H The protein levels of HIF-1α, HK2, PFKP, and PKM2 in shCtr//231 and shZeb1/231 cells under normoxic and hypoxic conditions in response to a PI3K/Akt inhibitor LY294002. I The enzyme activities of HK, PFK, and PKM in shCtrl/231 and shZeb1/231 cells under normoxic and hypoxic conditions in response to LY294002. Dots depict individual samples in (A–C). Data are representative of five (A, C) or three (B, D–F, H, I) independent experiments and presented as mean ± SEM. *P < 0.05, **P < 0.01, ***P < 0.001 vs the respective control by an unpaired Student’s t-test.

