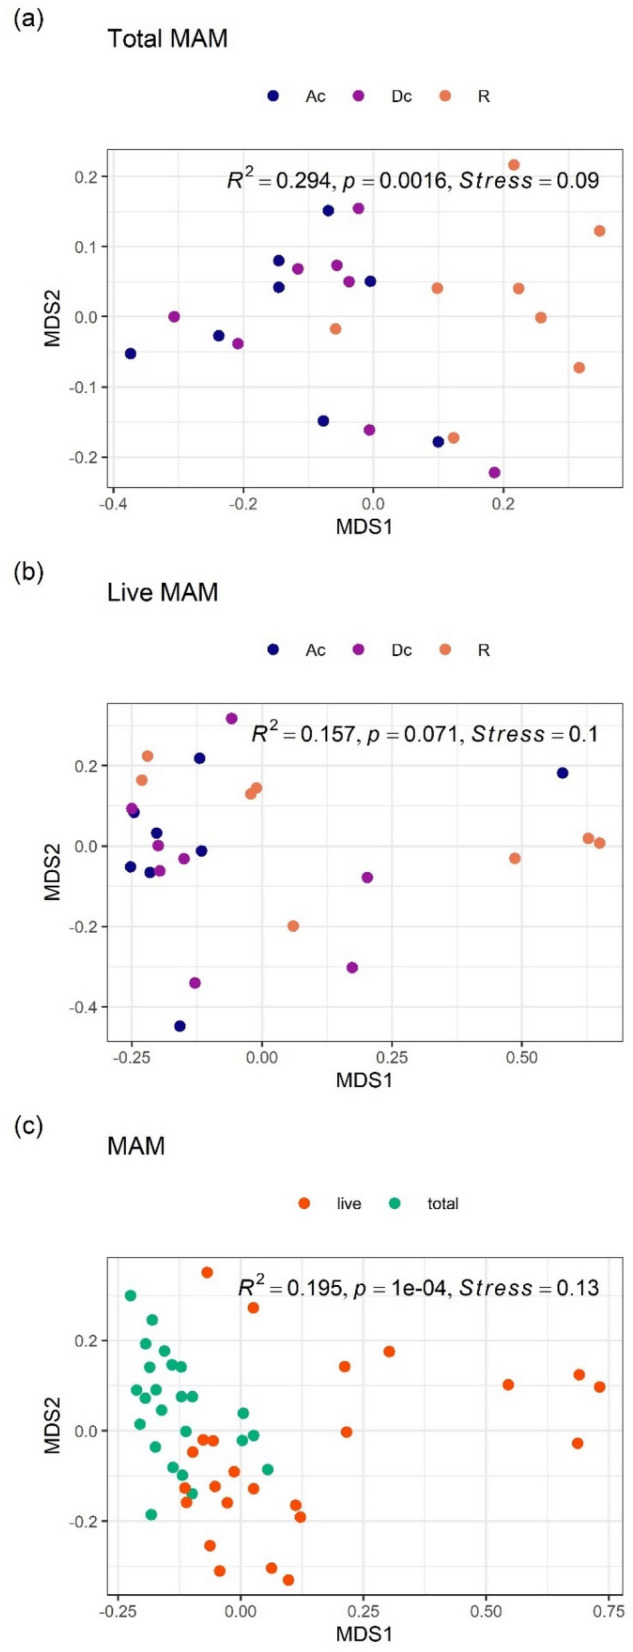
Figure 3.

NMDS ordinations and PERMANOVA analyses of MAM composition. (a) Overall comparison of total MAM composition among three gut sites, (b) overall comparison of live MAM composition among three gut sites, (c) overall comparison between total and live MAM composition. All ordinations and PERMANOVA analyses were performed using Bray–Curtis distance matrix based on relative abundance of taxa at the family level. NMDS: Non-metric multidimensional scaling; MAM: mucosa-associated microbiota; Ac: ascending colon; Dc: descending colon; R: rectum.
