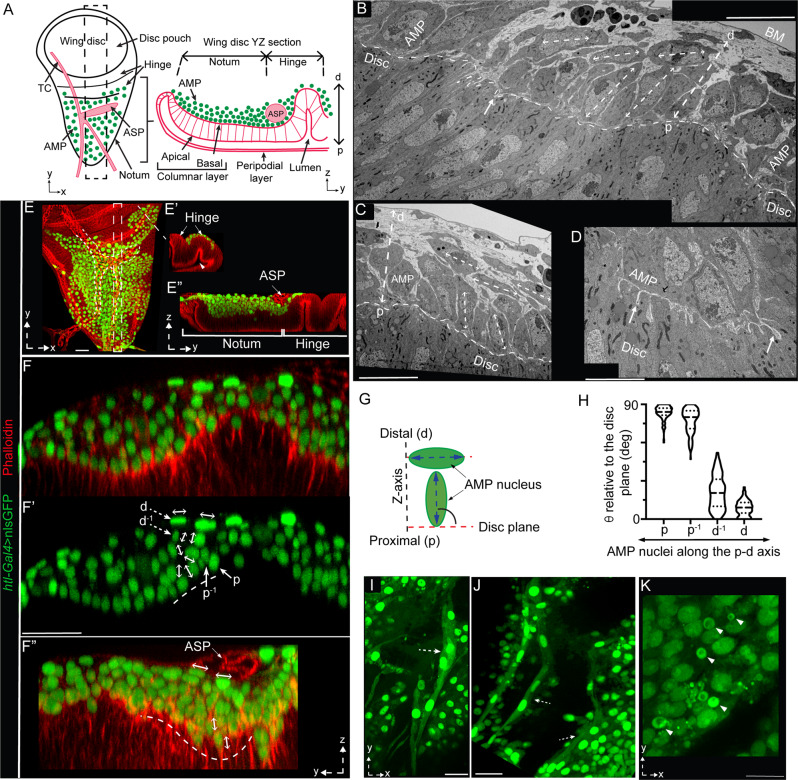
Fig. 1. Correlation of the AMP position and polarity relative to the disc.
A Drawing of an L3 wing disc showing the spatial organization of AMPs, wing disc notum and hinge areas, and ASP (air-sac primordium) and TC (transverse connective); dashed box (left), ROI used for all subsequent YZ cross-sectional images. B–D TEM sections of wing disc (w1118) showing YZ views of different wing disc notum areas; double-sided dashed arrows, long axes of elliptical AMPs; p-d dashed arrow, proximo (p)-distal (d) axis relative to the disc plane (dashed line); white arrow, cytoneme-like disc-invading projections from AMPs (D see Supplementary Fig. 1A,A’); BM basement membrane. E–E” Spatial organization of nls:GFP-marked AMP nuclei, orthogonal to the wing disc notum (E, E”) and hinge (E, E’) as illustrated in A. F–H Cross-sections of wing disc regions (indicated in ROI box in A) harboring nls:GFP-marked AMPs; double-sided arrows, nuclear orientation; F’ green channel of F; dashed and solid arrows, distal and proximal layer cells, respectively; G drawing illustrating the strategy to measure nuclear orientation as angles (Theta, θ) between AMP nuclei and the disc plane; H graph showing quantitative analyses of AMP nuclear orientation at different disc-relative locations; p: proximal (125 nuclei), d: distal (58 nuclei), p−1: one layer above p (119 nuclei), d−1: one layer below d (84 nuclei); also see Supplementary Table 1 and see “Methods” section for statistics; source data are provided as a “Source Data” file. I–K Single XY optical sections of the discs, showing diverse morphologies of distal AMPs; dashed arrows, elongated syncytial cells; arrowhead, small nonpolar cells (also see Supplementary Fig. 1B–D’). E, F” red, phalloidin, marking tissue outlines (also indicated by dashed line). Genotype: UAS-nls:GFP/+; htl-Gal4/+ (E–K). Scale bars: 20 μm; 10 μm (B, C, K); 5 μm (D).

