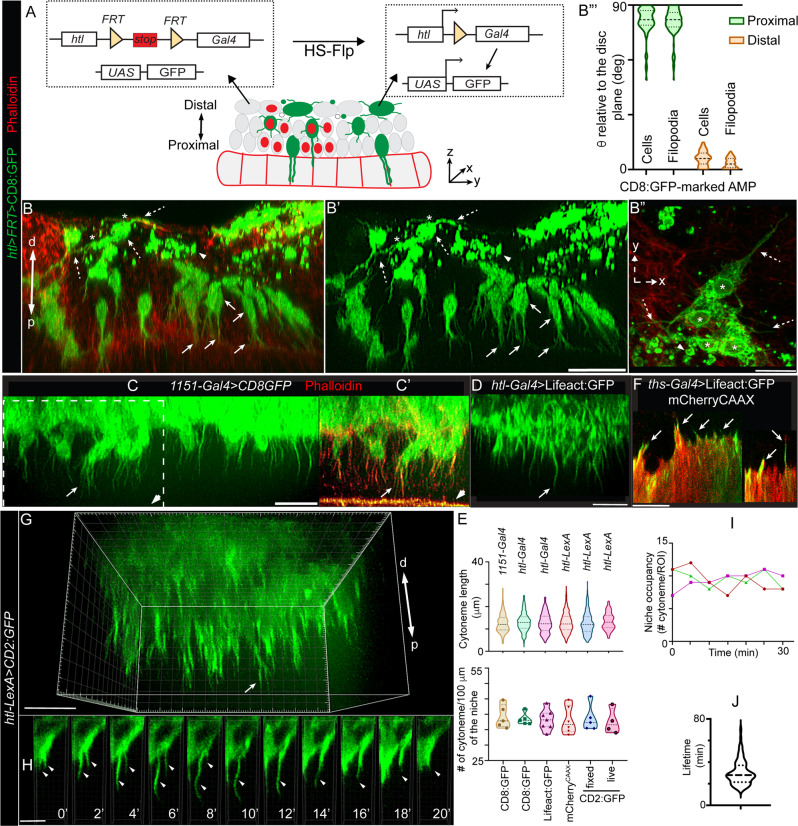
Fig. 2. Disc-specific AMP polarity and adhesion are linked to polarized AMP cytonemes.
A Schematic depiction of htl>FRT>stop>FRT>Gal4 construct and its application to generate FLIP-out clones exclusively in AMPs (also see Supplementary Fig. 1E, F). B-B” Wing disc harboring random CD8:GFP-marked AMP clones (hs-Flp; UAS-CD8:GFP; htl>FRT>stop>FRT>Gal4) showing orthogonal and lateral polarity of AMPs and AMP cytonemes relative to disc plane; arrow and dashed arrow, proximal and distal AMPs/AMP cytonemes, respectively; arrowhead, distal small non-polar cells; *, adherent distal AMPs; phalloidin (red), actin-rich disc-AMP junction and cell-cortex (also see Supplementary Fig. 1G–H”); B’ GFP channel of B; B”’ Violin plots showing angles (Theta, θ; see Fig. 1G) between proximal and distal AMPs and their cytonemes relative to their underlying disc plane (see Supplementary Table 2 for statistical analyses). C–E Comparison of AMP cytonemes (arrows) marked by various fluorescent proteins driven by different transcription drivers, in fixed and live tissues, as indicated; arrowhead, actin-rich (phalloidin-marked) apical-junction of disc epithelium; E Graphs comparing length and numbers (count/100 μm length of AMP-disc interface) of orthogonal cytonemes (n = >125 cytonemes for each genotype/condition, imaged from >5 wing disc/genotype under fixed condition and four discs under live condition; see “Source Data” for statistics). F Actin-rich cytonemes (arrow) from wing disc cells expressing mCherryCAAX and Lifeact:GFP (fixed tissue). G–J Live dynamics of AMP cytonemes; G 3D-rendered image showing live cytonemes captured from p-to-d direction of the tissue; H dynamics of cytonemes (arrow) (2 min time-lapse, also see Supplementary Movies 1–4); I Graphs showing numbers of niche-occupying cytonemes over time within selected ROIs; three graph colors, three discs; J Graph showing the distribution of cytonemes lifetimes (n = 77 cytonemes; also see Supplementary Fig. 2D). Source data for B”‘, I, and J are provided as a “Source Data” file. C–J Genetic crosses: enhancer-Gal4/-LexA x UAS-/LexO-fluorescent protein (FP), as indicated. Scale bars: 20 μm; 5 μm (H).

