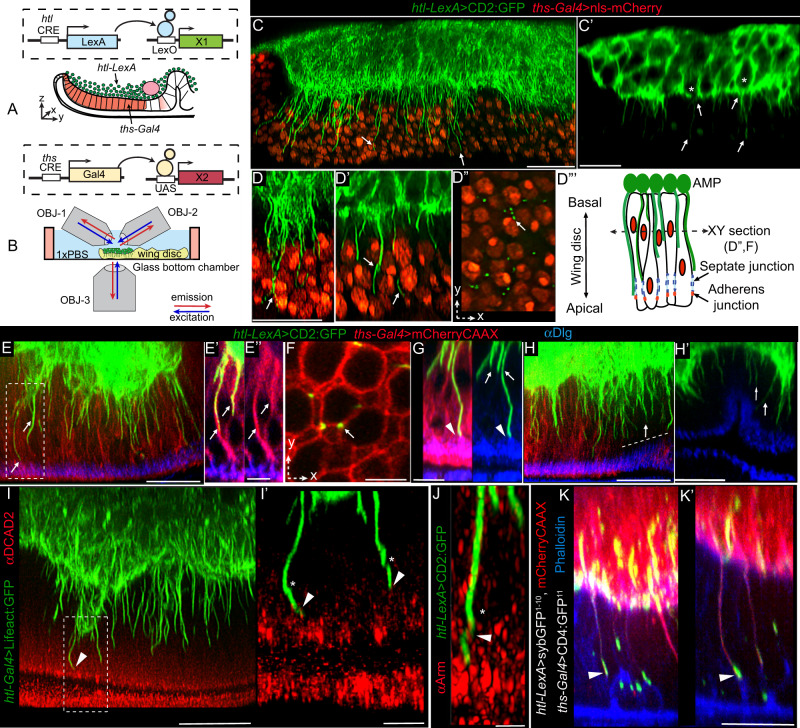
Fig. 3. AMP cytonemes anchor AMPs to the wing disc adherens junctions.
A, B Schematic depictions of the genetic strategy (A) used to simultaneously mark AMPs and the disc notum, and imaging strategy (B) using multi-view microscopy for deep-tissue imaging. C, D”’ Triple-view confocal imaging showing CD2:GFP-marked orthogonally polarized cytonemes (arrow) emanating from disc-proximal AMPs (*, in C’) and invading through the intercellular space between nls:mCherry-marked disc cells (C, D, D’); D”-D”’ single XY cross-sections of disc, as illustrated in D”’, showing multiple cytonemes sharing the same intercellular space. E–H’ CD2:GFP-marked AMP cytonemes at the intercellular space of mCherryCAAX-marked wing discs approaching apical adherens junctions (Dlg stain, blue); E’, E”, dashed box area in E; F XY cross-section of disc showing niche sharing by multiple cytonemes; G Airyscan image of cytoneme tip approaching adherens junction (arrowhead), H, H’ AMP cytonemes (arrow) in both ths-Gal4 expressing (red) and non-expressing areas (dashed line). I, J Tip regions of AMP cytonemes contacting disc adherence junction that is marked with DCAD2 (I, I’) and Arm (J); *, helical twists in cytonemes; arrowhead, contact sites; I’ zoomed-in image from ROI in I. K, K’ Synaptic cytoneme-disc contact sites mapped by syb-GRASP (see “Methods” section) between sybGFP1–10- and mCherryCAAX-expressing AMP cytonemes and the actin-rich (phalloidin, blue) apical junction of CD4:GFP11-expressing wing-disc cells. All images are YZ cross sections unless noted. All panels, Gal4/UAS or LexA/LexO or genetic combinations of both used, as indicated (see Methods). Scale bars: 20 μm; 5 μm (E, E’, I’, F, G); 2 μm (J).

