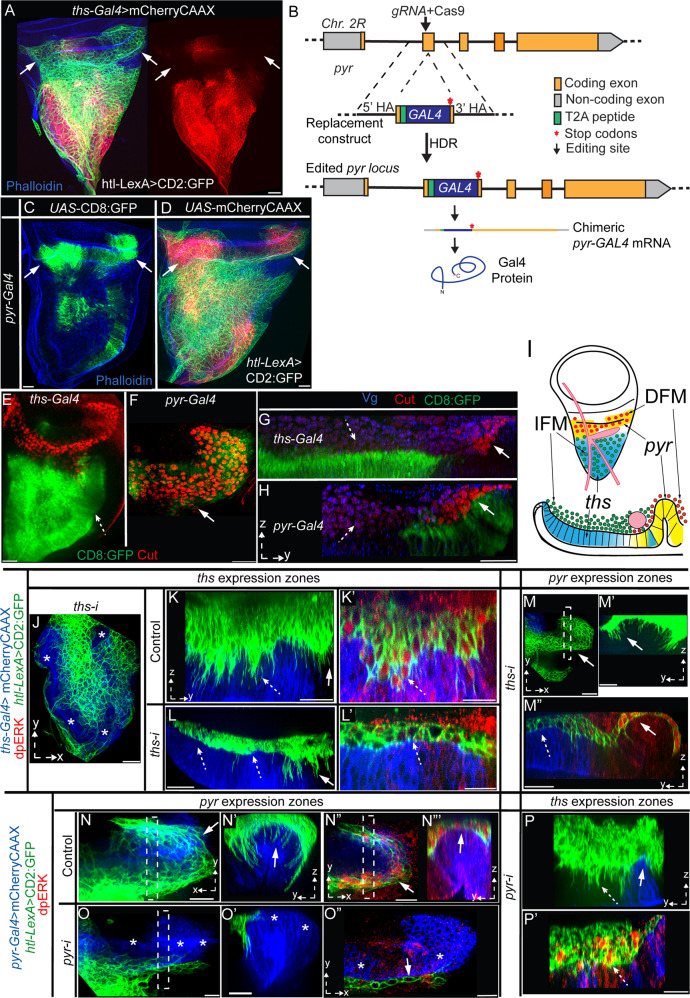
Fig. 6. Wing discs express Pyr and Ths in distinct zones to support different AMP subtypes.
A Spatial patterns of ths-Gal4-driven mCherryCAAX expression in the wing disc notum and the distribution of CD2:GFP-marked AMPs; arrow, ths expression-free hinge area; right panel, red channel from the left panel. B Scheme depicting the genome editing strategy to generate a pyr-Gal4 enhancer trap construct (see Supplementary Fig. 3). C, D Wing disc expression patterns of pyr-Gal4-driven CD8:GFP (C) and mCherryCAAX (D) and its spatial correlation to the AMP distribution (D arrow). E–I Images showing CD8:GFP-marked ths-Gal4 and pyr-Gal4 expression zones in wing discs and their correlation with the localization of IFM-specific (high Vg, blue; low Cut, red; dashed arrow) and DFM-specific (high Cut, red; dashed arrow) progenitors; I schematic depicting the results of E–H. J–M” Images, showing effects of ths-i expression from ths source (ths-Gal4; mCherryCAAX-marked, blue) on the resident AMPs (AMP number, cytonemes, polarity, multi-layered organization, and dpERK signaling (red)) and non-resident AMPs (over the unmarked pyr-zone); dotted line (M”), ASP. N–P’ Images showing effects of pyr-i expression from pyr source (pyr-Gal4, blue area) on the resident AMPs and non-resident AMPs (unmarked ths-expression zone). J–P’ solid arrows, pyr expression zone; dashed arrow, ths-expression zone; dashed box, ROIs used to produce YZ views. Scale bars: 20 μm.

