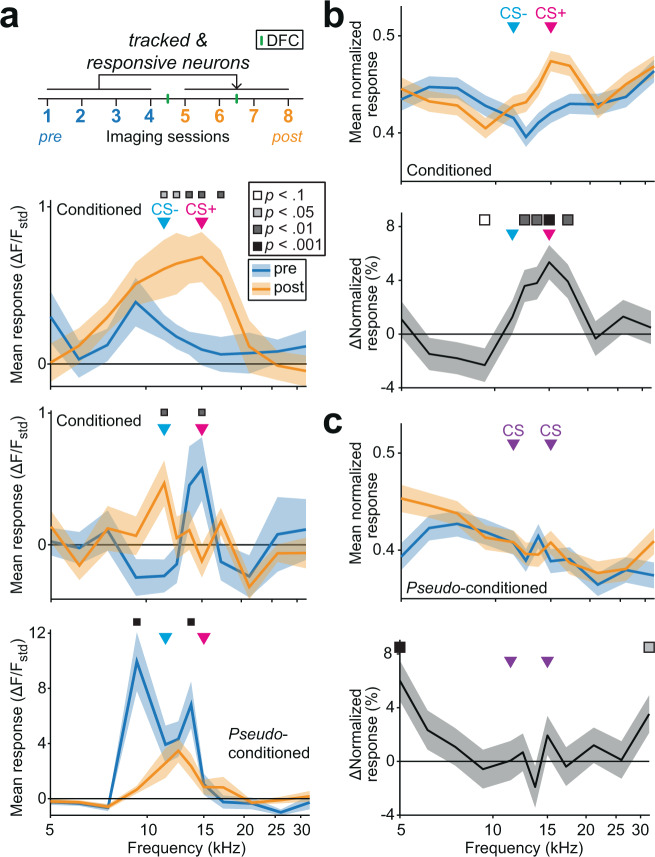
Fig. 5. Changes in frequency representation post-DFC.
a Mean (±sem) response across repeated presentations (N = 25 repetitions). We tracked the responses of neurons responsive at least once pre- and post-DFC. The panels show three example frequency response functions from tracked neurons from conditioned and pseudo-conditioned mice pre-DFC (blue) and post-DFC (orange). Significant differences in the response functions are indicated by the squares above (two-way rm-ANOVA, Tukey–Kramer post hoc analysis, Supplementary Table 1). Arrows show the frequencies of the CS− (11.4 kHz) and CS+ (15 kHz) and CSc. Squares indicate significant changes (two-way rm-ANOVA, Tukey–Kramer post hoc analysis, Supplementary Table 1). b (top) Mean (±sem) normalized frequency response functions of tracked responsive neurons across all conditioned mice (N = 14 mice, n = 879 neurons). (bottom) Mean (±sem) percent change in normalized frequency response functions of the same neurons, squares indicate significant changes (two-way rm-ANOVA, Tukey–Kramer post hoc analysis, Supplementary Table 1). c (top) Same (b) for pseudo-conditioned mice (N = 9 mice, n = 626 neurons). (bottom) Percent change in normalized frequency response functions for the same cells as above, squares indicate significant changes (two-way rm-ANOVA, Tukey–Kramer post hoc analysis, Supplementary Table 1). Source data are provided as a Source data file.

