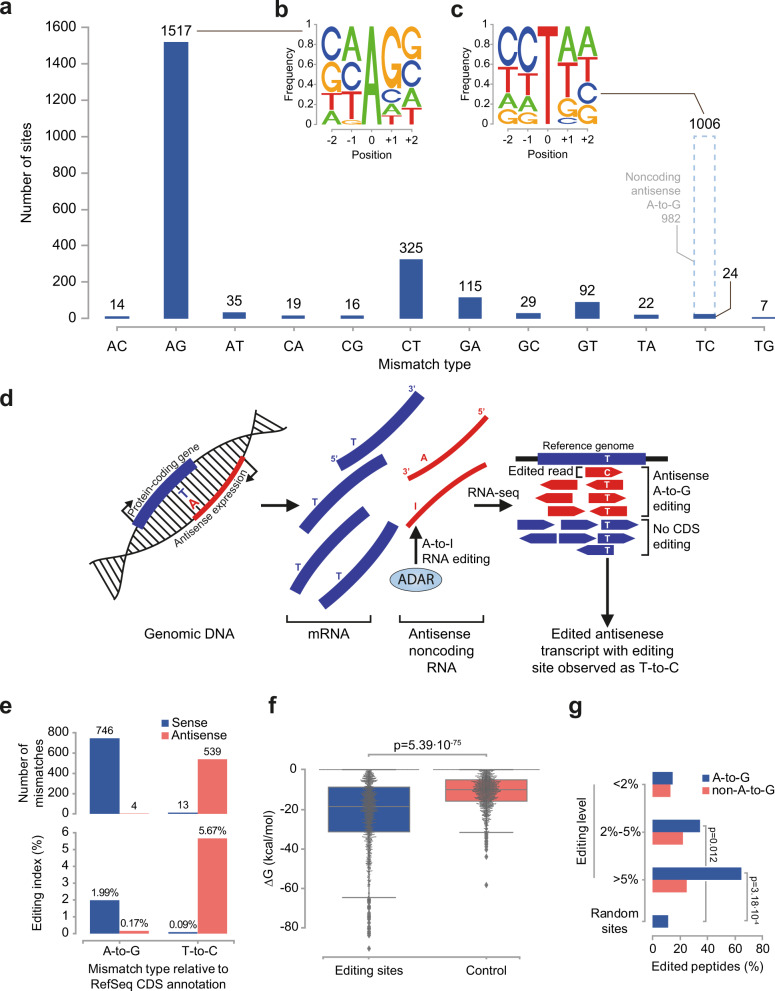
Fig. 2. The set of 1517 detected sites exhibits ADAR-dependent RNA editing features.
a Distribution of the 12 possible substitution types. The ADAR-derived A-to-G substitution constitutes ~68% of the total mismatches detected within the coding sequence. We estimate that ~982 of the 1006 T-to-C sites (~98%; dashed light-blue line) are due to non-CDS A-to-I editing events on the non-coding strand (see panel E below). b The local DNA sequence preference surrounding the A-to-G sites is consistent with the previously-reported ADAR preference. c The T-to-C sites show the same local sequence preference, reverse-complemented, suggesting that they result from ADAR-mediated editing of RNA expressed from the antisense strand. d An antisense RNA (red) expressed from a locus that overlaps a protein-coding exon (blue). A-to-I editing produces inosines in the antisense transcripts, manifested as Gs in RNA-seq reads. Mapping these strand-insensitive reads to the reference genome, antisense editing events appear as T-to-C mismatches with respect to the protein-coding strand. e Top: Analysis of strand-specific RNA-seq samples reveals that 539 out of the 552 T-to-C sites covered by the strand-specific RNA-seq dataset (~98%) were actually A-to-G substitutions on the antisense strand. In comparison, 99.5% of sites annotated as A-to-G originated from the coding strand, as expected. Bottom: The strand-specific RNA editing index (“Methods”) was calculated separately for A-to-G and T-to-C mismatches, showing negligible, indistinguishable from zero, editing level for T-to-C sites on the coding strand. f A swarm plot showing the distribution of free energies for in-silico RNA secondary structures surrounding the 1517 A-to-G sites and the same number of random adenosines as controls. The A-to-G editing sites form significantly more stable structures. P-value by Mann–Whitney test. Box-and-whisker plots show the medians (horizontal lines), upper and lower quartiles (box edges), and 1.5 × the interquartile range (whiskers). g Proteomic mass spectrometry data (“Methods”) reveals peptides supporting editing for 65% (11/17) of the sites edited to >5% and covered by peptides, compared to 11% (18/158) for random control sites (p = 0.00032; two-tailed Fisher’s exact test). In comparison, peptides supporting editing were found for only 15% (13/89) of the weakly-edited (<2%) sites (p = 0.56, compared to random control sites).

