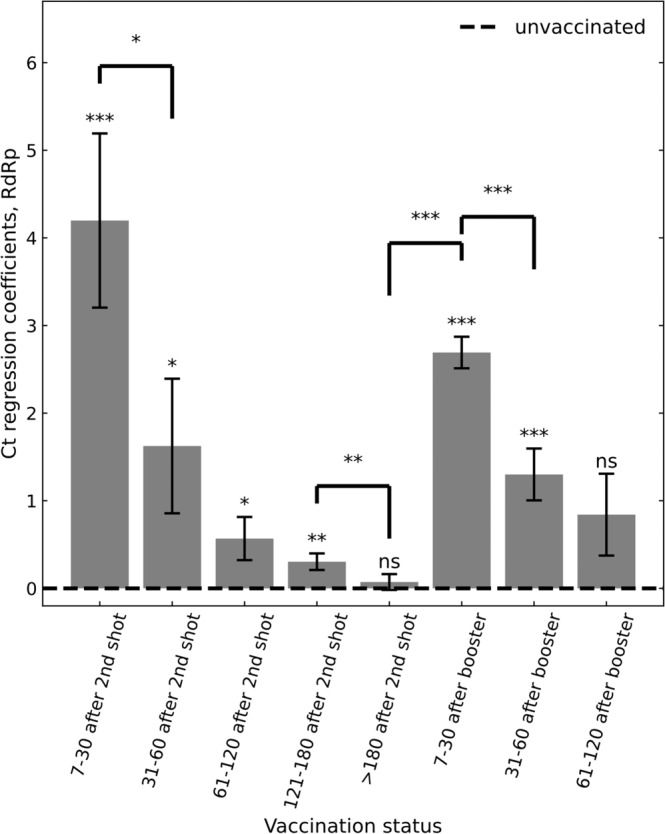
Fig. 1. Association of infection Ct with two-dose vaccination and the booster.

Ct regression coefficients, indicating an infection Ct relative to unvaccinated control group (dashed line), show an initial increase in Ct in the first month after the second vaccination dose, which then gradually diminishes. Increased Ct is restored after the booster, yet this regained effectiveness also gradually diminishes. Coefficients were obtained by multivariate linear regression analysis, adjusting for age, sex and calendric date (Methods; n = 22,657). Error bars represent one standard error of the mean. All P values are two sided: ‘ns’, not significant, *P < 0.05, **P < 0.01, ***P < 0.001. Data are shown for Ct of the RdRp gene; for genes N and E, see Supplementary Fig. 1a, b.
