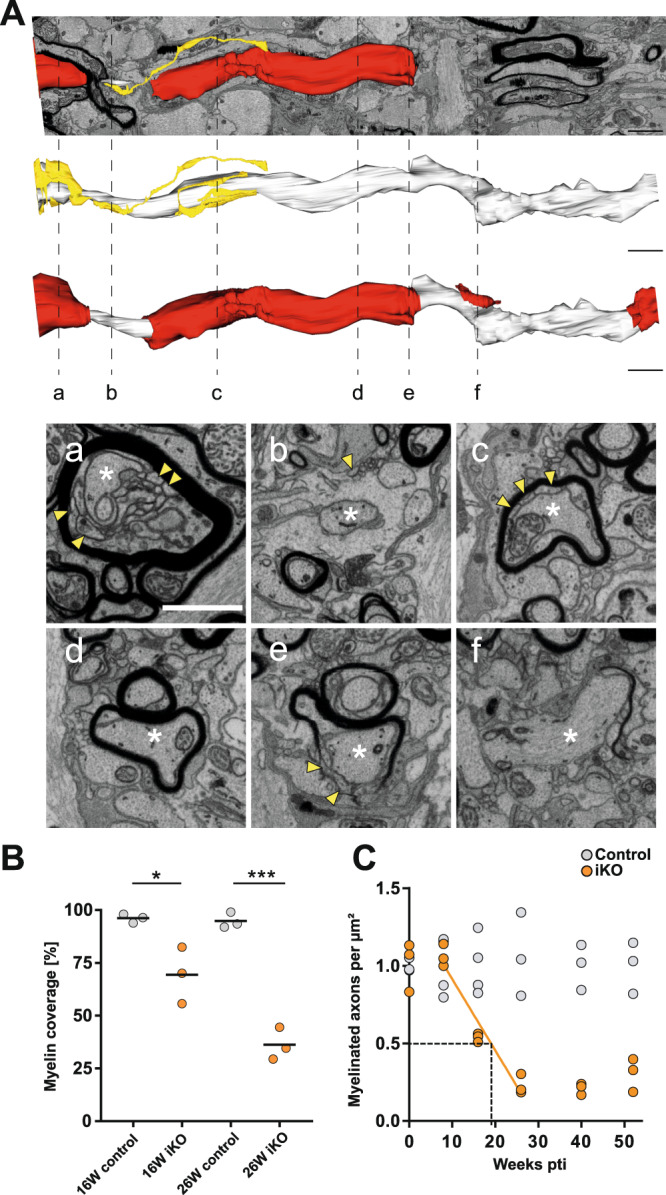
Fig. 5. Demyelination by internode shortening in Mbp iKO mice.

A 3D reconstruction of an image stack acquired by focused ion beam-scanning electron microscopy (FIB-SEM) at 26 weeks pti in the optic nerve of an iKO mouse (shown in Supplementary Movie 1): Yellow: non-compact myelin tubules, white: axon, (white asterisk) red: myelin. At stippled lines, the indicated corresponding image from the stack is shown. Yellow arrowheads point at myelin tubules. Internodes are shortened and fragmented. B Quantification of myelin coverage on 3D volumes of iKO and control mice (n = 3) 16 weeks pti and (n = 3) 26 weeks pti with >90 axons per mouse in the percentage of axonal length within the FIB-SEM volume that is myelinated. Unpaired two-tailed t test (16 weeks pti p = 0.027; p < 0.05 (*); 26 weeks pti p = 0.0003; p < 0.001 (***), male and female mice). C Myelinated axons counted per area on TEM images and normalized to control (n = 3). The regression line indicates a 50% loss of myelinated axons within 19–20 weeks pti. At 26 weeks pti, demyelination is maximal. Source data are provided with this paper. Scale bars: A 2 µm; a 1 µm.
