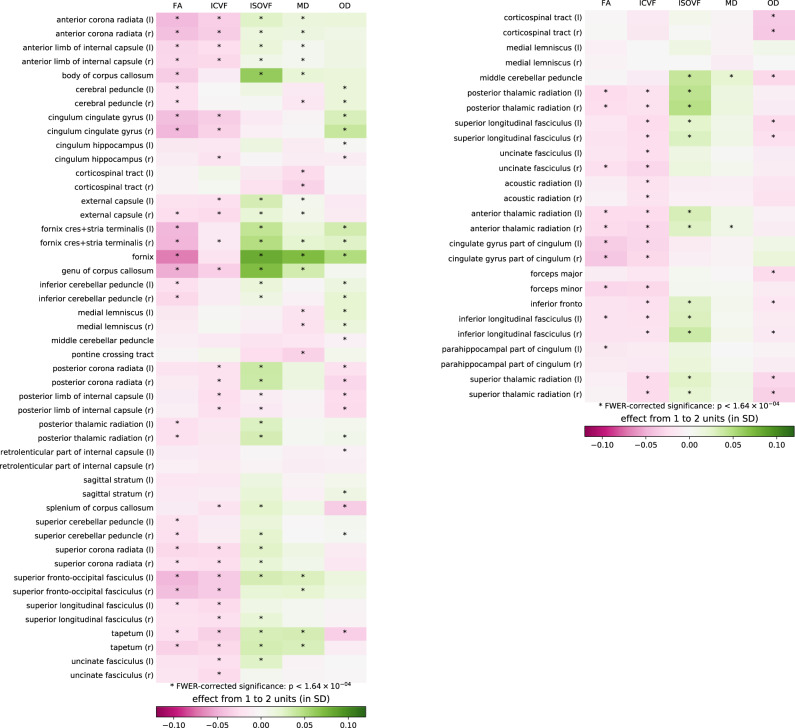
Fig. 5. Associations between daily alcohol units and white matter microstructure indices of interest across white matter tract regions.
Asterisks denote statistically significant effects, p < 1.64 × 10⁻⁴. Colors represent the expected change in each imaging derived phenotype resulting from the increase in daily consumption from 1 to 2 units, based on the regression model. FA fractional anisotropy, ICVF intracellular volume fraction, ISOVF isotropic volume fraction, MD mean diffusivity, OD orientation dispersion, r right, l left.

