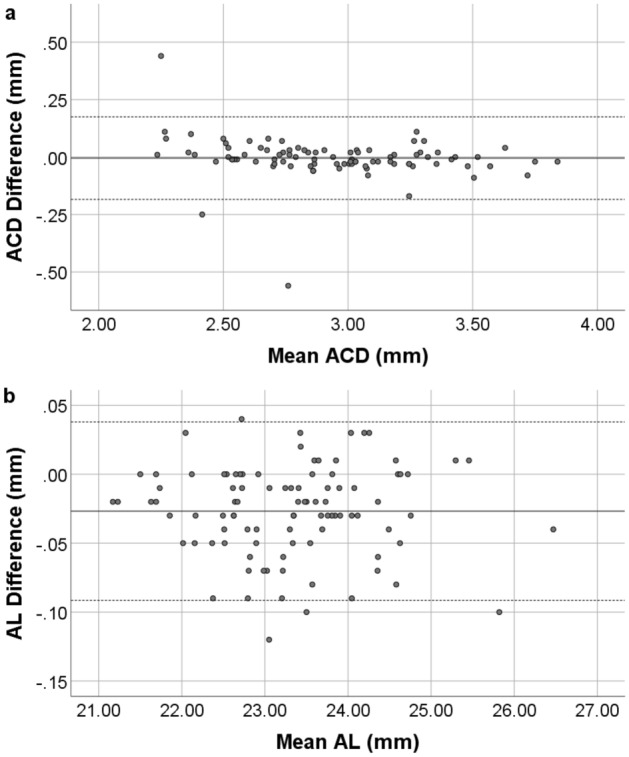
Figure 1.

Bland–Altman plot of the ACD (a) and AL (b) from GALILEI G6 and ANTERION. The solid line represents the mean difference, whereas the dotted lines on each side show the upper and lower 95% LoA. The ACD and AL plot demonstrate that only three and four eyes respectively of the total of 96 eyes were out of the 95% LoAs, indicating excellent agreement in ACD and AL between the two devices. Created by SPSS (Version 22, SPSS Inc., IBM, Chicago, USA).
