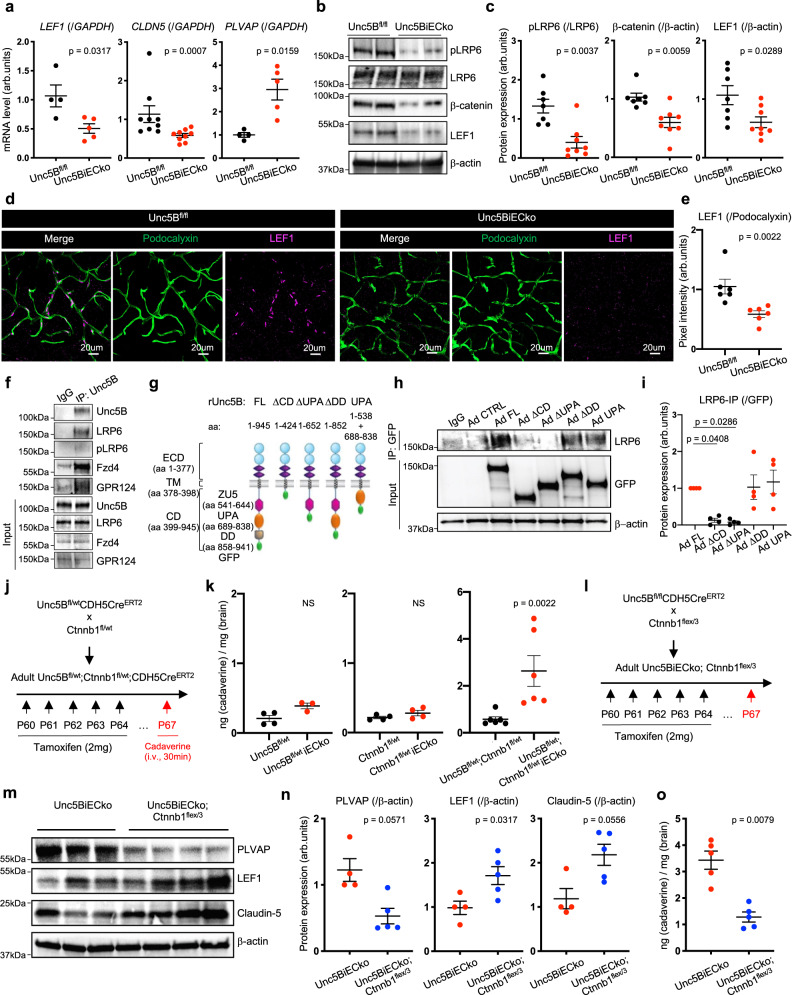
Fig. 3. Unc5B regulates BBB Wnt/β-catenin signaling.
a qPCR analysis of P67 brain mRNA extracts, n = 4 Unc5Bfl/fl and n = 5 Unc5BiECko brains for quantification of LEF1 and PLVAP mRNA levels, n = 9 Unc5Bfl/fl and n = 9 Unc5BiECko brains for quantification of CLDN5 mRNA levels. Each dot represents one mouse. One control mouse was set as 1. Western blot (b) and quantification (c) of Wnt/β-catenin signaling components in brain protein extracts, n = 7 Unc5Bfl/fl and n = 8 Unc5BiECko brains. Each dot represents one mouse. One control mouse was set as 1. Immunofluorescence (d) and quantification (e) of LEF1 staining on adult brain sections. Each dot is the mean of several images, n = 6 Unc5Bfl/fl and n = 6 Unc5BiECko brains. One control mouse was set as 1. f CTRL IgG and Unc5B immunoprecipitation on cultured brain endothelial cells, reproduced on n = 3 independent experiment. g Schematic of Unc5B adenoviral constructs. CTRL IgG or GFP immunoprecipitation in Unc5B siRNA knockdown ECs infected with siRNA resistant Unc5B adenovirus (h), and quantification of LRP6 pulldown (i), n = 4 independent experiment. Each dot represents one independent experiment. j Unc5B and Ctnnb1 gene deletion strategy using tamoxifen injection in adult mice. k Quantification of cadaverine content in P67 brains, 30 min after i.v. cadaverine injection, n = 4 Unc5Bfl/wt, n = 3 Unc5Bfl/wtiECko, n = 4 Ctnnb1fl/wt, n = 4 Ctnnb1fl/wtiECko, n = 6 Unc5Bfl/wt;Ctnnb1fl/wt and n = 6 Unc5Bfl/wt;Ctnnb1fl/wtiECko brains. Each dot represents one mouse. l Unc5B gene deletion and Ctnnb1flex/3 gene overexpression strategy using tamoxifen injection. Western blot (m) and quantification (n) of P67 brain protein extracts, n = 4 Unc5BiECko and n = 5 Unc5BiECko;Ctnnb1flex/3 brains. Each dot represents one mouse. One control mouse was set as 1. o Quantification of P67 brain cadaverine content, 30 min after i.v cadaverine injection, n = 5 Unc5BiECko and n = 5 Unc5BiECko;Ctnnb1flex/3 brains. Each dot represents one mouse. All data are shown as mean ± SEM. NS non-significant. Two-sided Mann–Whitney U test was performed for statistical analysis between two groups. ANOVA followed by Bonferroni’s multiple comparisons test was performed for statistical analysis between multiple groups. Source data are provided as a Source Data file.

