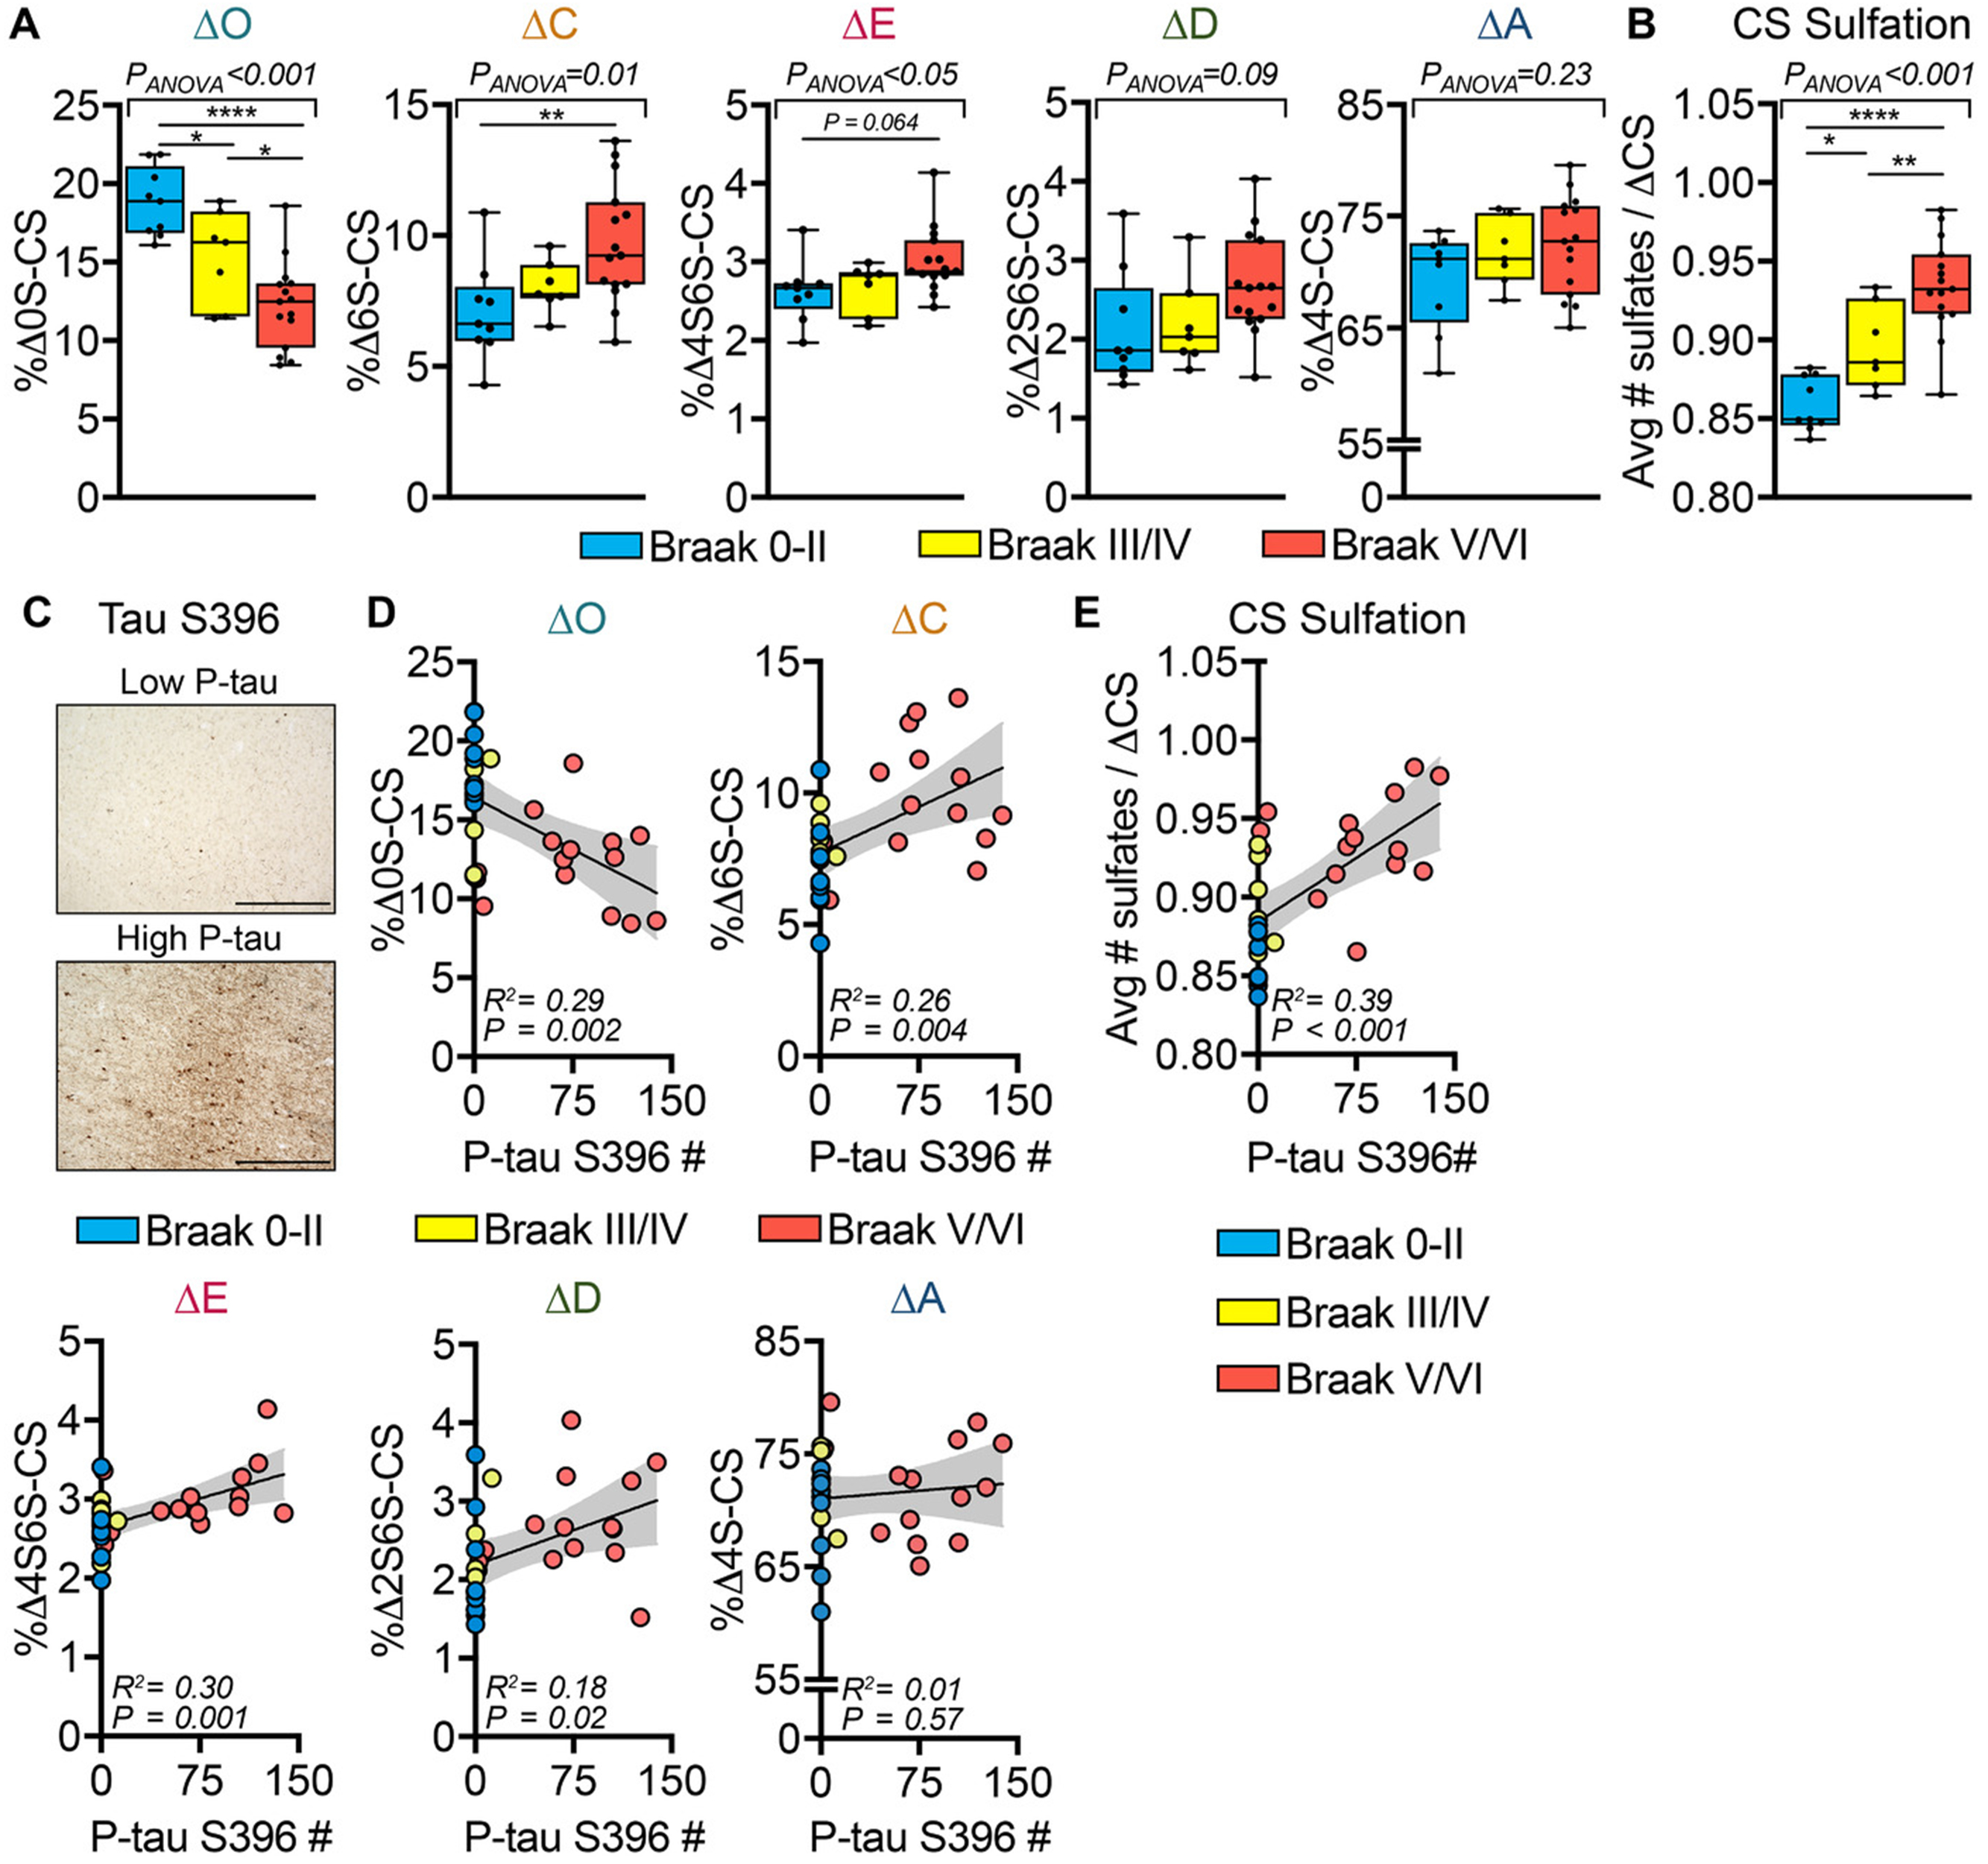
Fig 2.

Changes in brain matrix chondroitin sulfate-glycosaminoglycan (CS-GAG) sulfation patterns correlate to Braak stage and phosphorylated tau (p-tau) accumulation. Demented (Alzheimer’s disease) and non-demented controls were stratified by pathology according to Braak stage: B0/1, Braak 0-II (blue); B2, Braak III/IV (yellow); and B3, Braak V/VI (red). A, The relative abundance of the five perineuronal net CS isomers (ΔO, ΔA, ΔC, ΔD, and ΔE) isolated from the middle frontal gyrus (MFG) and (B) CS-GAG hypersulfation were correlated to Braak stage. C, After CS-GAG extraction, the MFG tissue sections were histochemically labeled for p-tau S396 (see Figure 1D). MFG p-tau+ inclusion number was correlated against changes in (D), each ΔCS and (E), CS-GAG hypersulfation from CS-GAGs isolated from the same tissue sections. A-B, n = 7–15 subjects per stage; mean ± standard deviation (SD). Data were analyzed using a mixed-effects, one-way analysis of variance model with Tukey’s multiple comparison (* P < .05, ** P < .01, **** P < .0001). C, Scale bar: 500 μm. MFG p-tau+ inclusions were correlated against the relative abundance of each ΔCS isomers isolated from the same tissue sections. D, n = 31 subjects; mean ± SD. Data were analyzed using linear regression with the 95% confidence bands shown in gray
