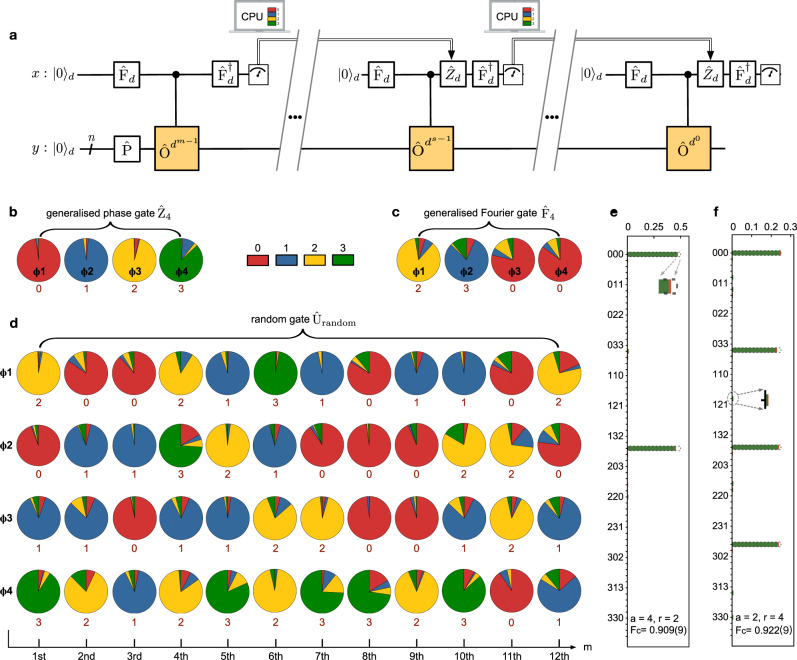
Fig. 5. Implementations of quaternary quantum phase estimation and order-finding.
a Their quantum logical circuit for implementing Kitaev’s scalable approaches. For the d-ary phase estimation, the task is to compute the eigenphase ϕ of a unitary O given its eigenstate of . For the d-ary order-finding, the task is to find the order of a function as (armodN) = 1. The x-register single-qudit state is initialised by the Fourier gate Fd; the y-register is prepared in the eigenstate ( state) for phase estimation (for order-finding). The terminates the x-register to output the desired solution in the computational basis. In the s-th step, the Zd rotation is added with a feedback angle of θs= − 0.0ϕs+1ϕs+2…ϕm, that is determined by previous measurements. The algorithm is iterated m times -- each step returns 1 dit result with d-ary accuracy, to obtain a m-dit estimation of the eigenphase of a unitary or the order of a function. b–d Measured probability pie-distributions of the four eigenphases (ϕ1, ϕ2, ϕ3, ϕ4) for three different unitary matrices, using the quaternary quantum phase estimation: b a generalised phase gate Z4 as diag[] where θ = 1/4; c a generalised Fourier gate F4; d a random gate Urandom (see form in Supplementary Note 5). Coloured sectors represent the experimental outcomes of {0,1,2,3} for each iteration, measured in the computational basis of {,,,}, respectively. The measured dominating sector is used to obtain every dit of the eigenphases; theoretical values for each dit are provided under the pies. The eigenphases are backwardly computed from the least significant dit from m = 12 to 1. e, f Measured probability distributions for the quaternary order-finding algorithm with a setting of a = 4 and a = 2, respectively. From the distributions, the order of r = 2 and r = 4 are experimentally computed with a 3-quart resolution (equivalent to 64-level), and with a classical statistic fidelity (Fc) of 0.909(9) and 0.922(9), respectively. The order-finding together with classical algorithm allows the factorisation of 15 = 3 × 5. Errors ( ± 1σ) arising from photon Poissonian noise are indicated as red shaded caps. Dashed lines refer to theoretical predictions. Experimental probability distributions in b–f are calculated from photon coincidences, which are accumulated by 20s per measurement.

