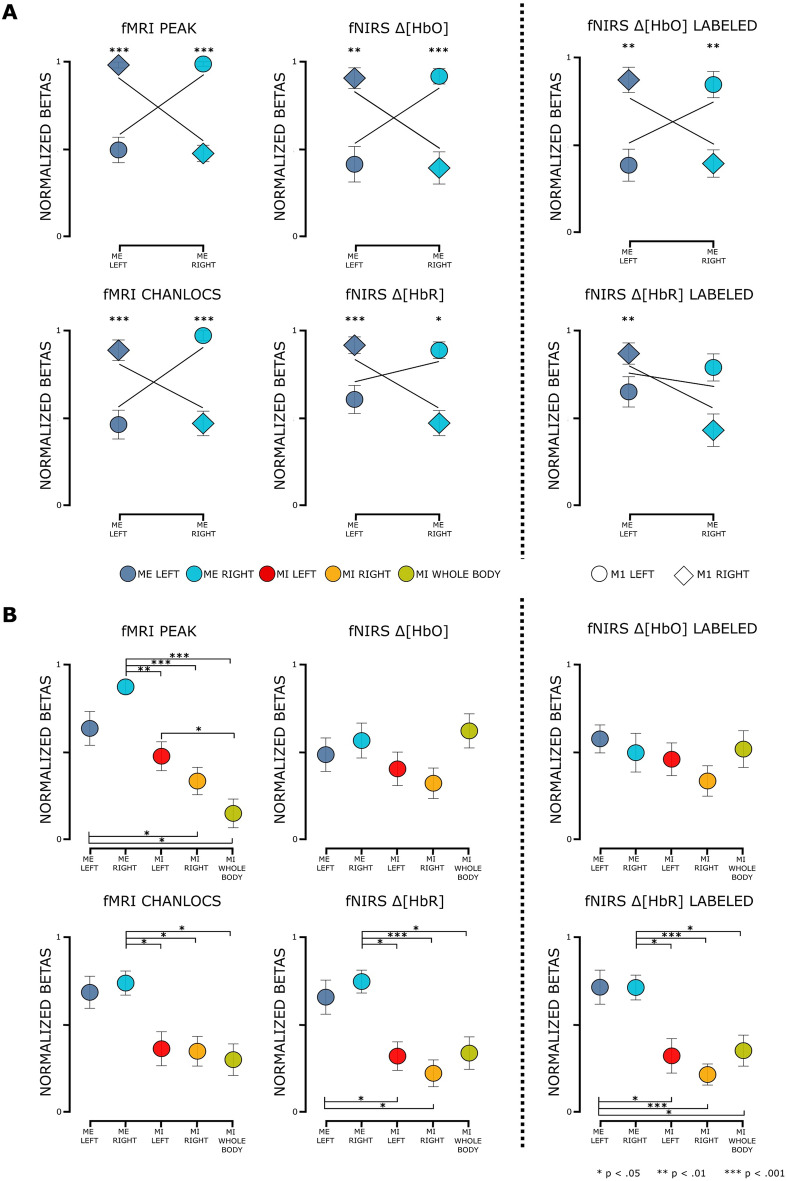
Figure 3.
Between subjects: task related activation patterns for (A) ME tasks in M1 ROIs and (B) all tasks in ROI SMA. Illustration of mean normalized beta scores (min-max beta values) and rmANOVA results for ME LEFT (blue) and ME RIGHT (turquoise), MI LEFT (red), MI RIGHT (orange) and MI WHOLE BODY (green) tasks for fMRI PEAK, fNIRS , fMRI CHANLOCS and fNIRS on the left side. On the right side of the dashed line the results from tasks fNIRS LABELED and fNIRS LABELED are shown. Note: Error bars represent standard error of the mean. Asterisks indicate significance corrected for multiple comparisons within a data type.

