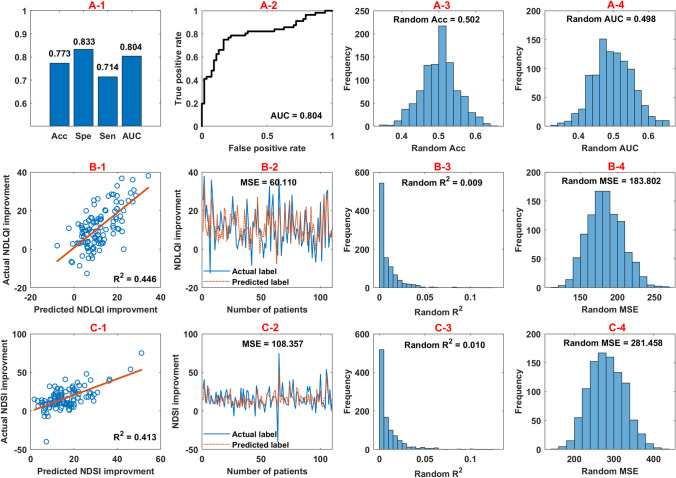
Fig. 2.
The performance of prediction models in the internal test set. (A-1) illustrates the overall performance of the SVC model in predicting acupuncture response at the end of treatment. (A-2) illustrates the receiver operating characteristic curve corresponding to the AUC. (B-1) and (C-1) show the scatter plots between the actual and the predicted improvements of NDLQI and NDSI of the internal test samples, respectively. (B-2) and (C-2) illustrate the predicted labels and their corresponding actual labels of these test samples. (A/B/C-3, A/B/C-4) displays the results of permutation tests for these predication analyses. Abbreviation: Acc, accuracy; Sen, sensitivity; Spe, specificity; AUC, area under the receiver operating characteristic curve; NDSI, Nepean Dyspepsia Symptom Index; NDLQI, Nepean Dyspepsia Life Quality Index; R2, coefficient of determination; MSE, mean squared error

