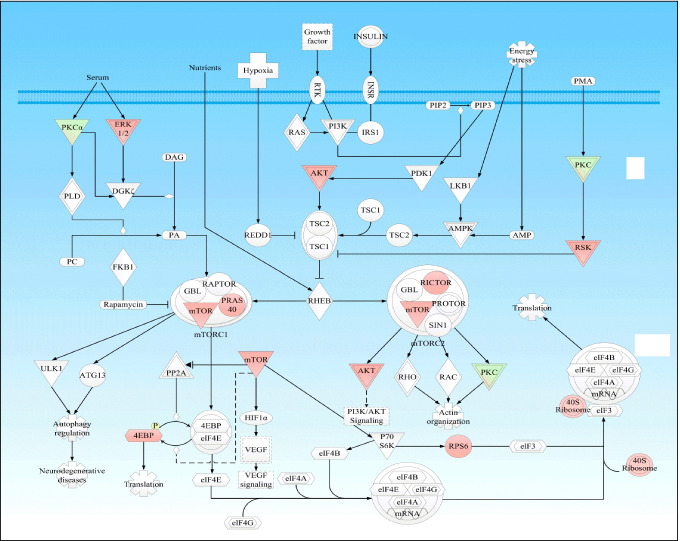
Fig. 2.
mTOR signaling pathway in NF-PitNETs. Red color = upregulation; Green color = downregulation. The gradient color degree represents slightly different expression tendency of that molecule. Modified from Long et al. (2019) [10], copyright permission from Frontiersin publisher open-access publication, copyright 2019

