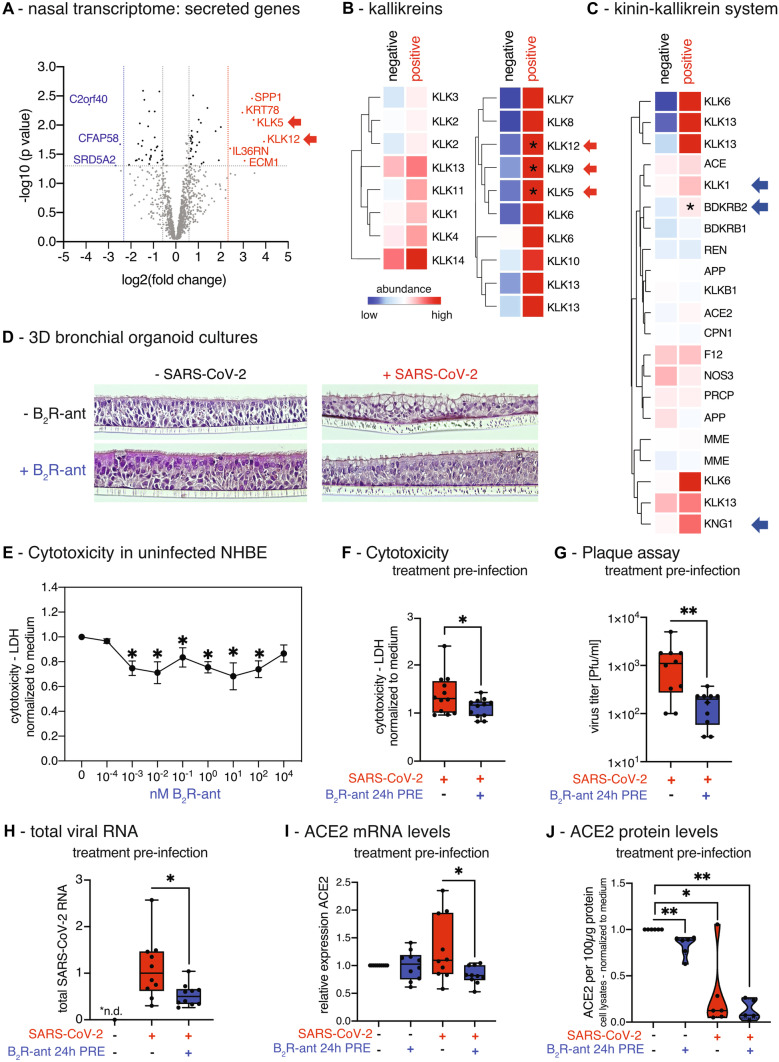
Fig. 1.
Induction of kallikreins and kinin receptor B2 in the nasal mucosa of acutely positive COVID-19 study participants. A Volcano plot of significantly differentially regulated genes (DEGs = differentially expressed genes) in nasal curettages of study participants that were acute positive for SARS-CoV-2 compared to healthy individuals (negative) using human miR microarray technology. Highlighted genes have a fold change (FC) ≥ 10 with P < 0.05; genes in red are upregulated; genes in blue are downregulated. B Heat map of gene expression analysis of kallikrein genes and C of genes of the kinin-kallikrein-system (KKS) in nasal curettages comparing acute SARS-CoV-2-positive study participants to healthy controls. All entities are shown. Asterisks indicate significantly regulated genes (P < 0.05) in SARS-CoV-2-infected NHBEs compared to medium. Color code indicates Log2-fold change from low (blue) through 0 (white) to high (red). Duplicate gene names indicate the abundance of two or more isoforms of the same gene in the analysis. D 3D-air–liquid interphase cultures from NHBEs were pre-treated for 24 h with/without 1 nM B2R-antagonist from the basal side and subsequently infected with SARS-CoV-2 for 48 h from the apical side. E Lactate dehydrogenase (LDH) cytotoxicity assay using the LDH Cytotoxicity Detection Kit PLUS studying the effect of increasing doses of the B2R-antagonist after 48 h in primary NHBEs from 4 donors. Results are depicted as mean ± s.e.m. Statistical tests compared each dose of B2R-antagonist with 0 nM B2R-antagonist. F Cytotoxicity assay determining LDH release into the supernatants of cultures of SARS-CoV-2-infected NHBEs from 12 donors that were pre-treated for 24 h with/without 1 nM B2R-antagonist. G Quantification of infectious particles in the supernatants of SARS-CoV-2-infected NHBEs from 10 donors that were pre-treated with/without 1 nM B2R-antagonist for 24 h. Supernatants were titrated on Vero-E6 cells and plaque assay was quantified 24 h later. Results are depicted as plaque-forming units (PFU) per milliliter. H qPCR analysis of total SARS-CoV-2 RNA (viral genome and transcripts, which all contain the N1 sequence region) normalized to human ACTB of SARS-CoV-2-infected primary NHBE after 24 h of pre-treatment with/without 1 nM B2R-antagonist followed by 24 h of SARS-CoV-2 inoculation. For Fig. 1E, F, and H, statistical tests compared SARS-CoV-2-infected versus uninfected samples or B2R-antagonist-treated versus untreated samples. I Analysis of human ACE2 gene expression using qPCR (n = 10) and J of human ACE2 protein levels analyzed by ELISA from cell lysates (n = 6) after 24 h of pre-treatment of NHBEs with/without 1 nM B2R-antagonist, followed by SARS-CoV-2 inoculation for 24 h

