Fig. 3.
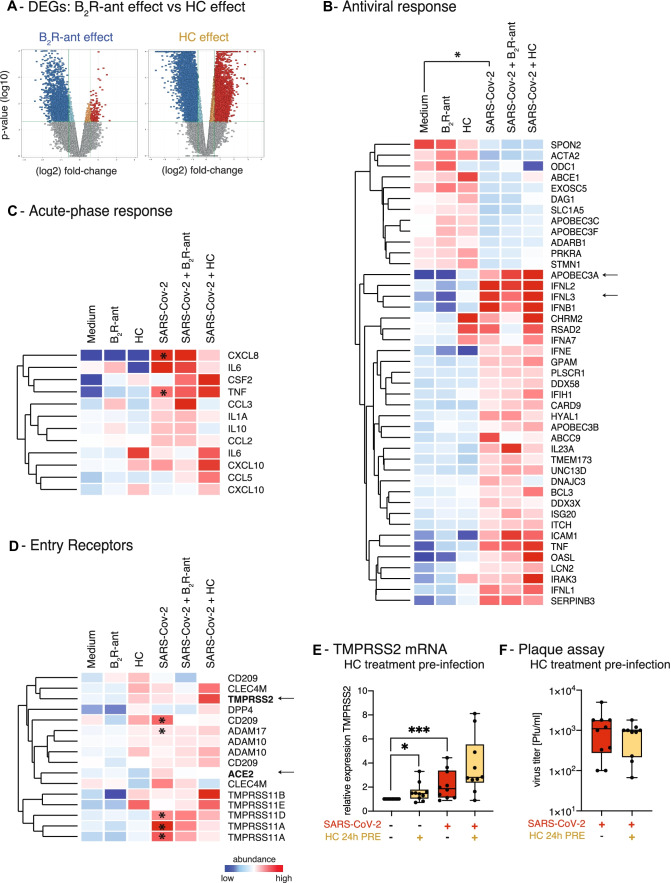
B2R-antagonism exhibits a protective and suppressive effect on gene expression profile of airway epithelial cells. A Volcano plots showing global gene expression changes induced by either treatment with B2R-antagonist or hydrocortisone (HC). Red indicates significantly upregulated entities; blue indicates significantly downregulated entities. Gene expression analysis of pre-treated NHBEs after 24 h of SARS-CoV-2-infection. B Heat map of gene expression analysis of genes involved in the epithelial antiviral response, analysis of the effects of SARS-CoV-2-infection. Only entities with significant changes between SARS-CoV-2-infection and medium are shown (gene expression fold change FC ≥ 1.5 with P < 0.05). C Heat map of gene expression analysis of genes involved in the acute-phase response is depicted. All entities are shown. Asterisks indicate significantly regulated genes (P < 0.05) in SARS-CoV-2 compared to medium. D Heat map of gene expression analysis of known and potential virus entry receptors is depicted. All entities are shown. Color code indicates Log2-fold change from low (blue) through 0 (white) to high (red). Asterisks indicate significantly regulated genes (P < 0.05) in SARS-CoV-2-infected NHBEs compared to medium. Duplicate gene names indicate the presence of two or more isoforms of the same gene in the analysis. E Analysis of TMPRSS2 gene expression by qPCR after 24 h of pre-treatment with/without 10 μM hydrocortisone (HC) followed by 24 h of SARS-CoV-2 inoculation. Red indicates SARS-CoV-2-infection; yellow indicates pre-treatment with hydrocortisone (HC). Statistical tests compared SARS-CoV-2-infected versus uninfected samples or B2R-antagonist-treated versus untreated samples. F Quantification of infectious particles in the supernatants of SARS-CoV-2-infected NHBEs from 10 donors that were pre-treated with/without 10 μM hydrocortisone (HC) for 24 h. Supernatants were titrated on Vero-E6 cells. The plaque assay was quantified 24 h later. Results are depicted as plaque-forming units (PFU) per milliliter

