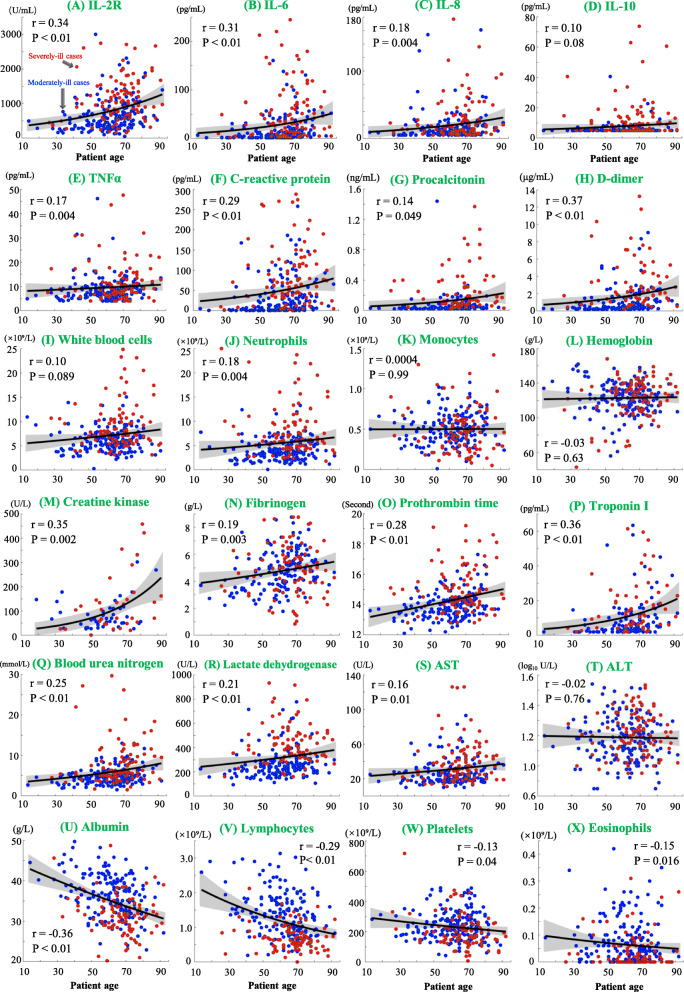
Fig. 2.
Correlation of baseline biomarkers with patient age. Red and blue dots indicate results from severely-ill and moderately-ill patients, respectively. The fitted linear polynomial curves and 95% confidence interval bounds are shown by black lines and gray area, respectively. Pearson’s correlation coefficients were measured for albumin (g/L), fibrinogen (g/L) and ALT (log10 U/L), while Spearman’s correlation coefficients were measured for other biomarkers whose distributions were not normal. Correlation coefficients (r) and their p-values (P) are shown

