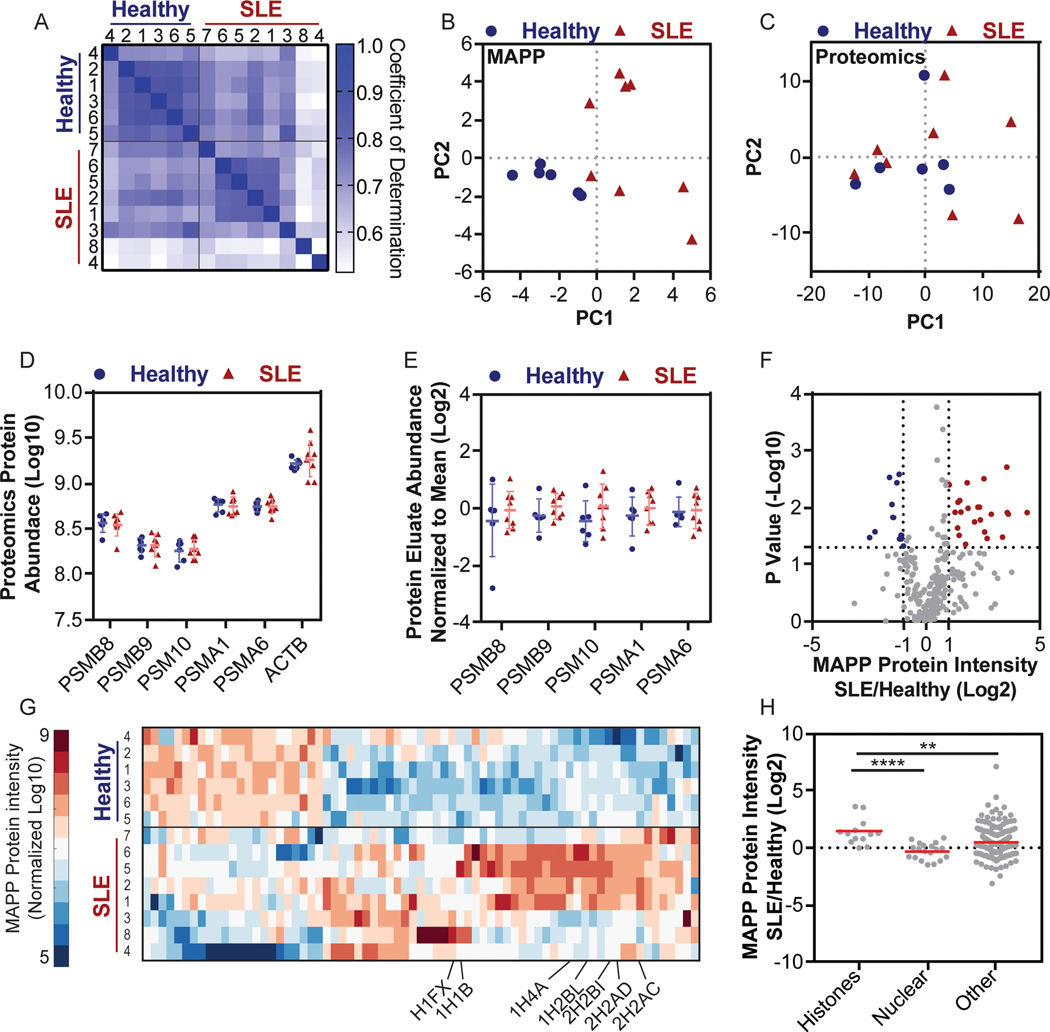
Figure 3. MAPP profiles distinguish between PBMCs from SLE patients and Healthy individuals.
PBMCs were purified from SLE patients and healthy individuals and analyzed by both MAPP and standard proteomics. (A) Matrix of the pairwise coefficient of determination in each sample of healthy individuals (n = 6) or SLE patients (n = 8). (B + C) Principal component analysis of protein intensities from PBMCs of healthy individuals or SLE patients, as identified by MAPP (B) or standard proteomics (C). (D) The abundance of proteasome subunits or actin (ACTB) in PBMCs was determined by standard proteomics (Log 10 transformed LFQ intensities; error bars: mean ±standard deviation). (E) The abundance of the indicated proteasome subunits in the protein fraction of the proteasome immunoprecipitate. Each subunit was normalized to the mean abundance (Log 2 normalized ratio of LFQ intensities; Bars: mean ± standard deviation). (F) Volcano plot of MAPP-identified proteins in PBMCs from healthy individuals or SLE patients (Log2 normalized ratio of LFQ intensities; -Log10 transformed P values). Two tailed t test, no correction for multiple comparisons. (G) Supervised clustering of proteins whose abundance changed by 2-fold or more between MAPP of healthy individuals and SLE patients (Log 10 transformed LFQ intensities standardized around 0, city block distance function). Identified histones are labeled. (H) Higher levels of histones are identified by MAPP of PBMCs from SLE patients, compared to healthy individuals (Histones lane, SLE/healthy). The ratio of histones in MAPP of SLE patients compared to healthy individuals is significantly higher than the ratio of other MAPP-identified proteins (Bootstrapped Mann-Whitney, P =0.0042; Log 2 transformed ratio of LFQ intensities), including other nuclear proteins (Two tailed Mann-Whitney, P < 0.0001, n = 13 (histones) n = 19 (nuclear) n = 202 (other) proteins. Bars: mean ± standard deviation.

