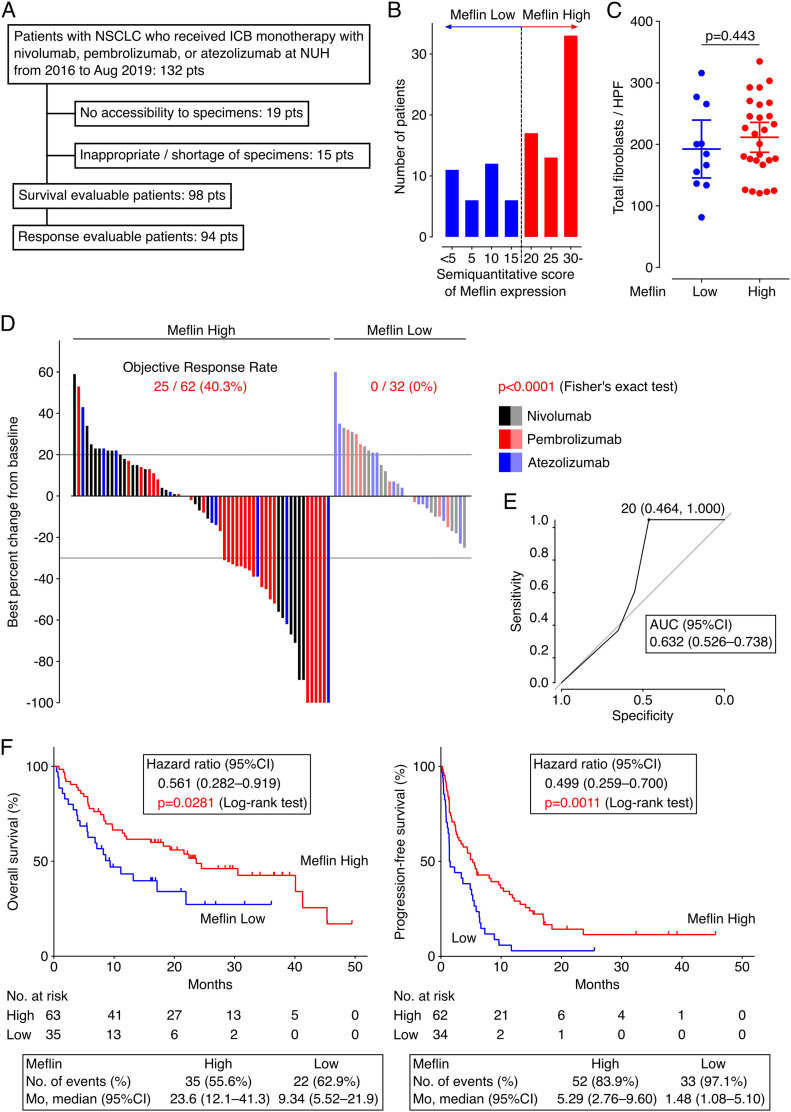
Figure 4. Non-small cell lung cancer (NSCLC) patients with high Meflin+ cancer-associated fibroblast (CAF) infiltration exhibit favorable responses to immune checkpoint blockade (ICB) therapy.
(A) Flow diagram of the selection of eligible patients with NSCLC who received ICB monotherapy for objective response rate analysis in our institution. (B) Distribution of patients with NSCLC stratified by the proportion of Meflin+ CAFs determined by ISH analysis. The number of Meflin+ CAFs was counted in randomly selected four high-power microscopic fields. The proportion of Meflin+ CAFs was calculated as the ratio of Meflin+ cells to all stromal cells with a spindle morphology. Meflin-high was defined as ≥20% of stromal cells stained for Meflin by ISH. (C) Total numbers of fibroblasts found in tissue sections obtained from Meflin-high and -low groups were counted and quantified. NSCLC cases whose surgical specimens were available (n = 38) were evaluated. HPF, high-power field. (D) A waterfall plot showing changes in tumor size from baseline determined according to iRECIST criteria in Meflin-high (left) and Meflin-low (right) patients with NSCLC who receive ICB monotherapy. Black, red, and blue bars indicate patients treated with nivolumab, pembrolizumab, and atezolizumab, respectively. (E) A receiver operating characteristics (ROC) curve for the percentage of Meflin+ CAFs in tumor stroma. The ROC curve was obtained by plotting sensitivity against specificity at each threshold setting. The area under the curve (AUC) (0.632; 95% CI, 0.526–0.738) shown in the plot summarizes the performance of Meflin+ CAFs in tumor stroma. (F) OS (left) and progression-free survival (right) of Meflin-high (red) and Meflin-low (blue) NSCLC patients treated with ICB therapy. The Meflin-high group showed a favorable response to ICB therapy compared with the Meflin-low group. Shown in the boxes below the plots are the observed numbers of events (deaths or disease progression) and median survival (months) of Meflin-high and Meflin-low groups over the follow-up periods. Mo, months.
Source data are available for this figure.

