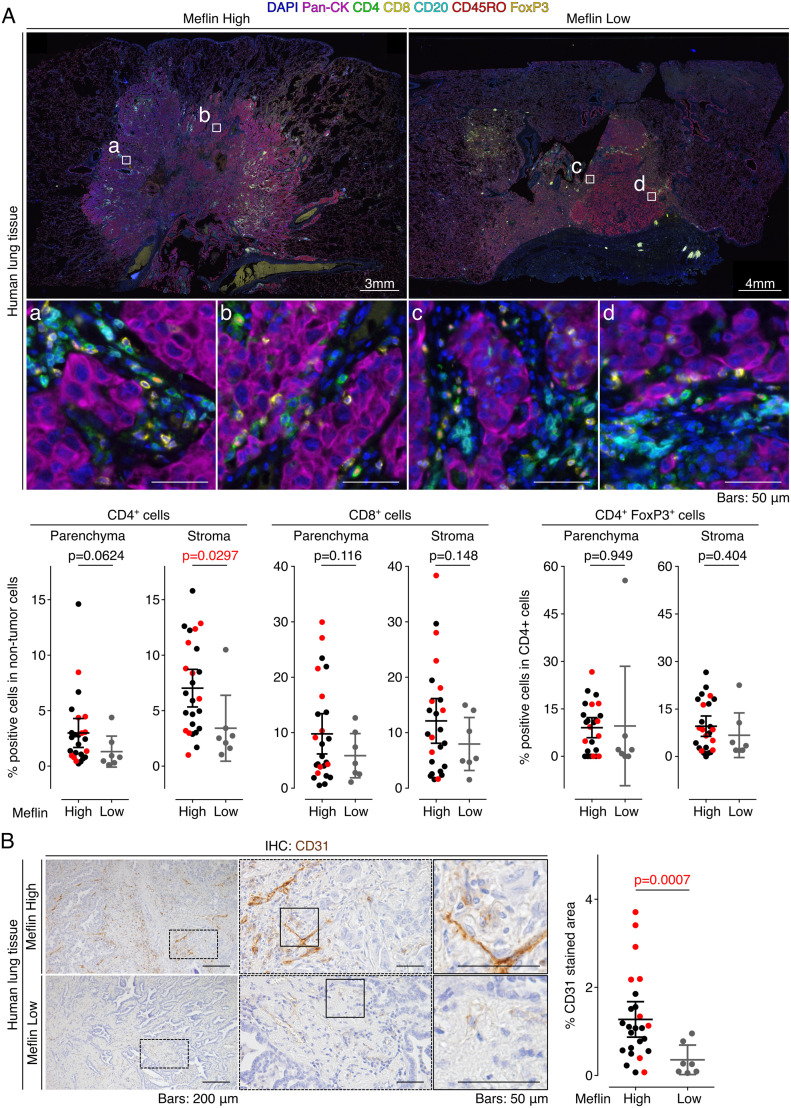
Figure 5. Meflin expression in cancer-associated fibroblasts correlates with tumor infiltration of CD4+ T cells and vascular area in non-small cell lung cancer patients treated with immune checkpoint blockade (ICB) monotherapy.
(A) Tissue sections prepared from tumors of patients with non-small cell lung cancer who received ICB monotherapy were stained by multiplex immunofluorescence for the indicated TIL markers, nuclei, and pan-cytokeratin (Pan-CK), followed by imaging with a multispectral imaging system. Representative images of Meflin-high (left, n = 25) and Meflin-low (right, n = 7) cases are shown. Boxed regions were magnified in lower panels. The lower panels’ graphs show the quantification of the percentage of CD4+, CD8+, and CD4+FoxP3+ T cells in all TILs infiltrated in intra-tumor (parenchyma) and stroma regions of each group. Red dots in the graphs denote the responders to ICB monotherapy. (B) Representative images of tissue sections of Meflin-high (upper panel) and Meflin-low (lower panel) tumors stained for CD31. The graph on the right shows the quantification of tumor vessel areas in each group. High magnification views randomly selected from 25 Meflin-high and 7 Meflin-low cases were analyzed and quantified. Red dots in the graphs denote the responders to ICB monotherapy.
Source data are available for this figure.

