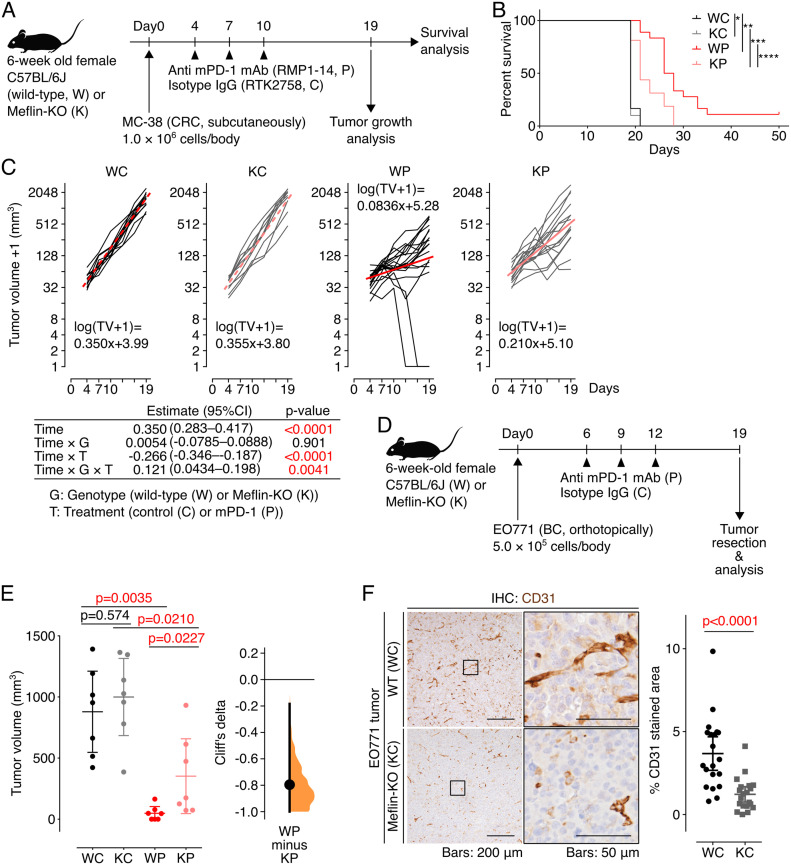
Figure 6. Tumors developed in Meflin-KO mice exhibit poor response to anti–mPD-1 therapy.
(A) An experimental protocol to test the antitumor effect of anti–mPD-1 therapy in mice. MC-38 mouse CRC cells were transplanted into C57BL/6 wild-type (W) or Meflin-KO (K) mice at day 0, followed by the intraperitoneal administration of anti–mPD-1 (P) or an isotype control antibody (C). (B) Survival of wild-type (W) and Meflin-KO (K) mice treated with isotype control (WC and KC, respectively) or treated with anti-mPD-1 antibody (WP and KP, respectively). The numbers of mice tested for WC, KC, WP, and KP groups were 12, 10, 18, and 16, respectively. *P = 0.658; **P < 0.0001; ***P = 0.0033; ****P = 0.0033. (C) Time courses of the volumes of tumors developed in the indicated groups (black and grey lines). For the log transformation of tumor volumes, one was added to every tumor volume. Red lines indicate linear approximations. The table shown under the graphs shows the restricted maximum likelihood estimates of each parameter in a linear mixed-effects model that includes the interactions of time, time and mouse genetic background (G), time and anti–mPD-1 therapy (T), and time and G and T while adding variable effects to the slope and intercept for each individual. (D, E) EO771 mouse BC cells were transplanted into wild-type (W) or Meflin-KO (K) mice at day 0, followed by the intraperitoneal administration of anti–mPD-1 antibody (P) or an isotype control antibody (C). The number of mice tested for each group was seven. Shown in (E) are the quantification of tumor volume of each group (left) and the nonparametric estimate of effect size calculated by Cliff’s delta (right). (F) Tissue sections from EO771 tumors developed in wild-type (WC) and Meflin-KO (KC) were stained for CD31 to visualize tumor vessels (left), followed by the quantification of the stained areas (right). Boxed regions were magnified in adjacent panels.
Source data are available for this figure.

