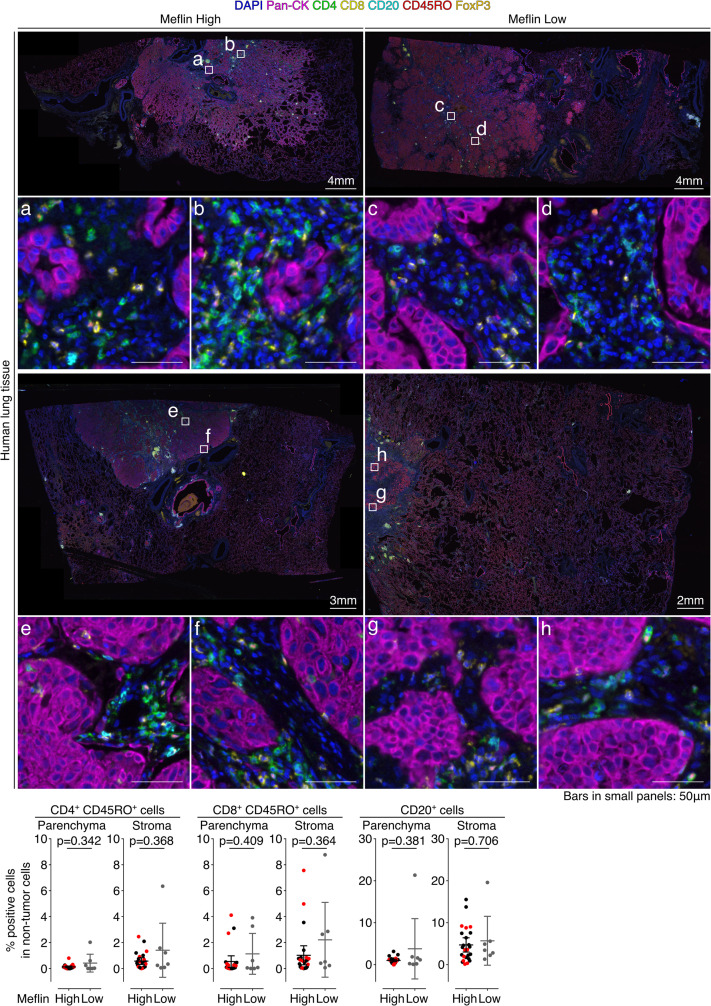
Figure S5. Quantification of TILs in Meflin-high and Meflin-low cases of non-small cell lung cancer tumors treated with immune checkpoint blockade monotherapy.
Two alternate examples (upper and lower images) of Meflin-high (left) or -low (right) non-small cell lung cancer tumor sections stained by multiplex immunofluorescence for the indicated TIL markers, nuclei, and pan-cytokeratin (Pan-CK), followed by imaging with a multispectral imaging system. Boxed regions are magnified in the lower panels. The lowest panel graphs show the quantification of the percentage of CD4+CD45RO+ T cells, CD8+CD45RO+ T cells, and CD20+ B cells in all TILs infiltrated in the intra-tumor (tumor parenchyma) and stroma regions of Meflin-high (n = 25) and Meflin-low (n = 7). Red dots in the graphs denote responders to immune checkpoint blockade monotherapy.

