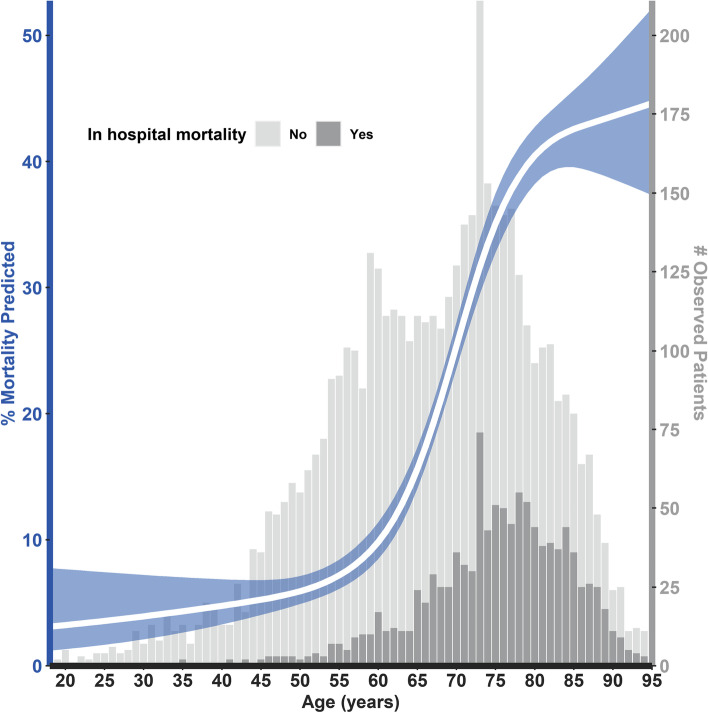
Fig. 1.
Predicted and observed in-hospital mortality (univariable age-restricted cubic spline adjusted). % Mortality predicted: The white line represents the predicted mortality rates at different ages, accompanied by 95% confidence intervals in blue. # Observed patients: The grey bars represent the number of patients observed within the different age categories. The light grey bars are the patients that were discharged without palliative care. The dark grey bars are the patients in which in-hospital mortality (or palliative discharge) occurred

