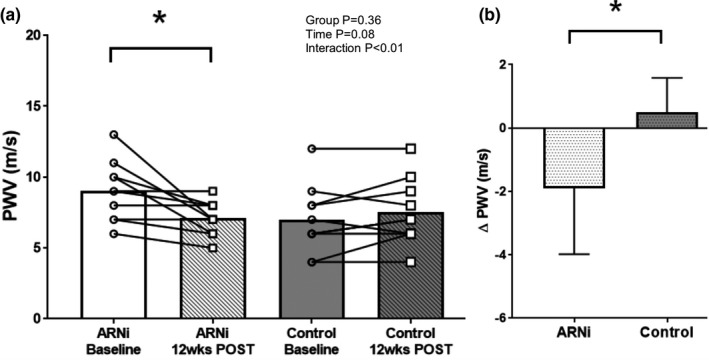
FIGURE 1.

(a) Pulse Wave Velocity (PWV) in ARNi (n = 10; 9 men and 1 woman) and Control groups (n = 10; 6 men and 4 women) at baseline and 12 weeks follow‐up. A 2 × 2 Analysis of variance (ANOVA) was used to determine differences in vascular function measures and post‐hoc LSD tests were conducted to evaluate pairwise differences among the means. ∆PWV was compared between two groups using t‐test. PWV was similar between ARNi and Control at baseline; PWV improved after 12 weeks of ARNi and remained unchanged in Control. (b) ∆PWV in ARNi and Control groups. ∆PWV in ARNi was lower when compared to Control. *p < 0.01
