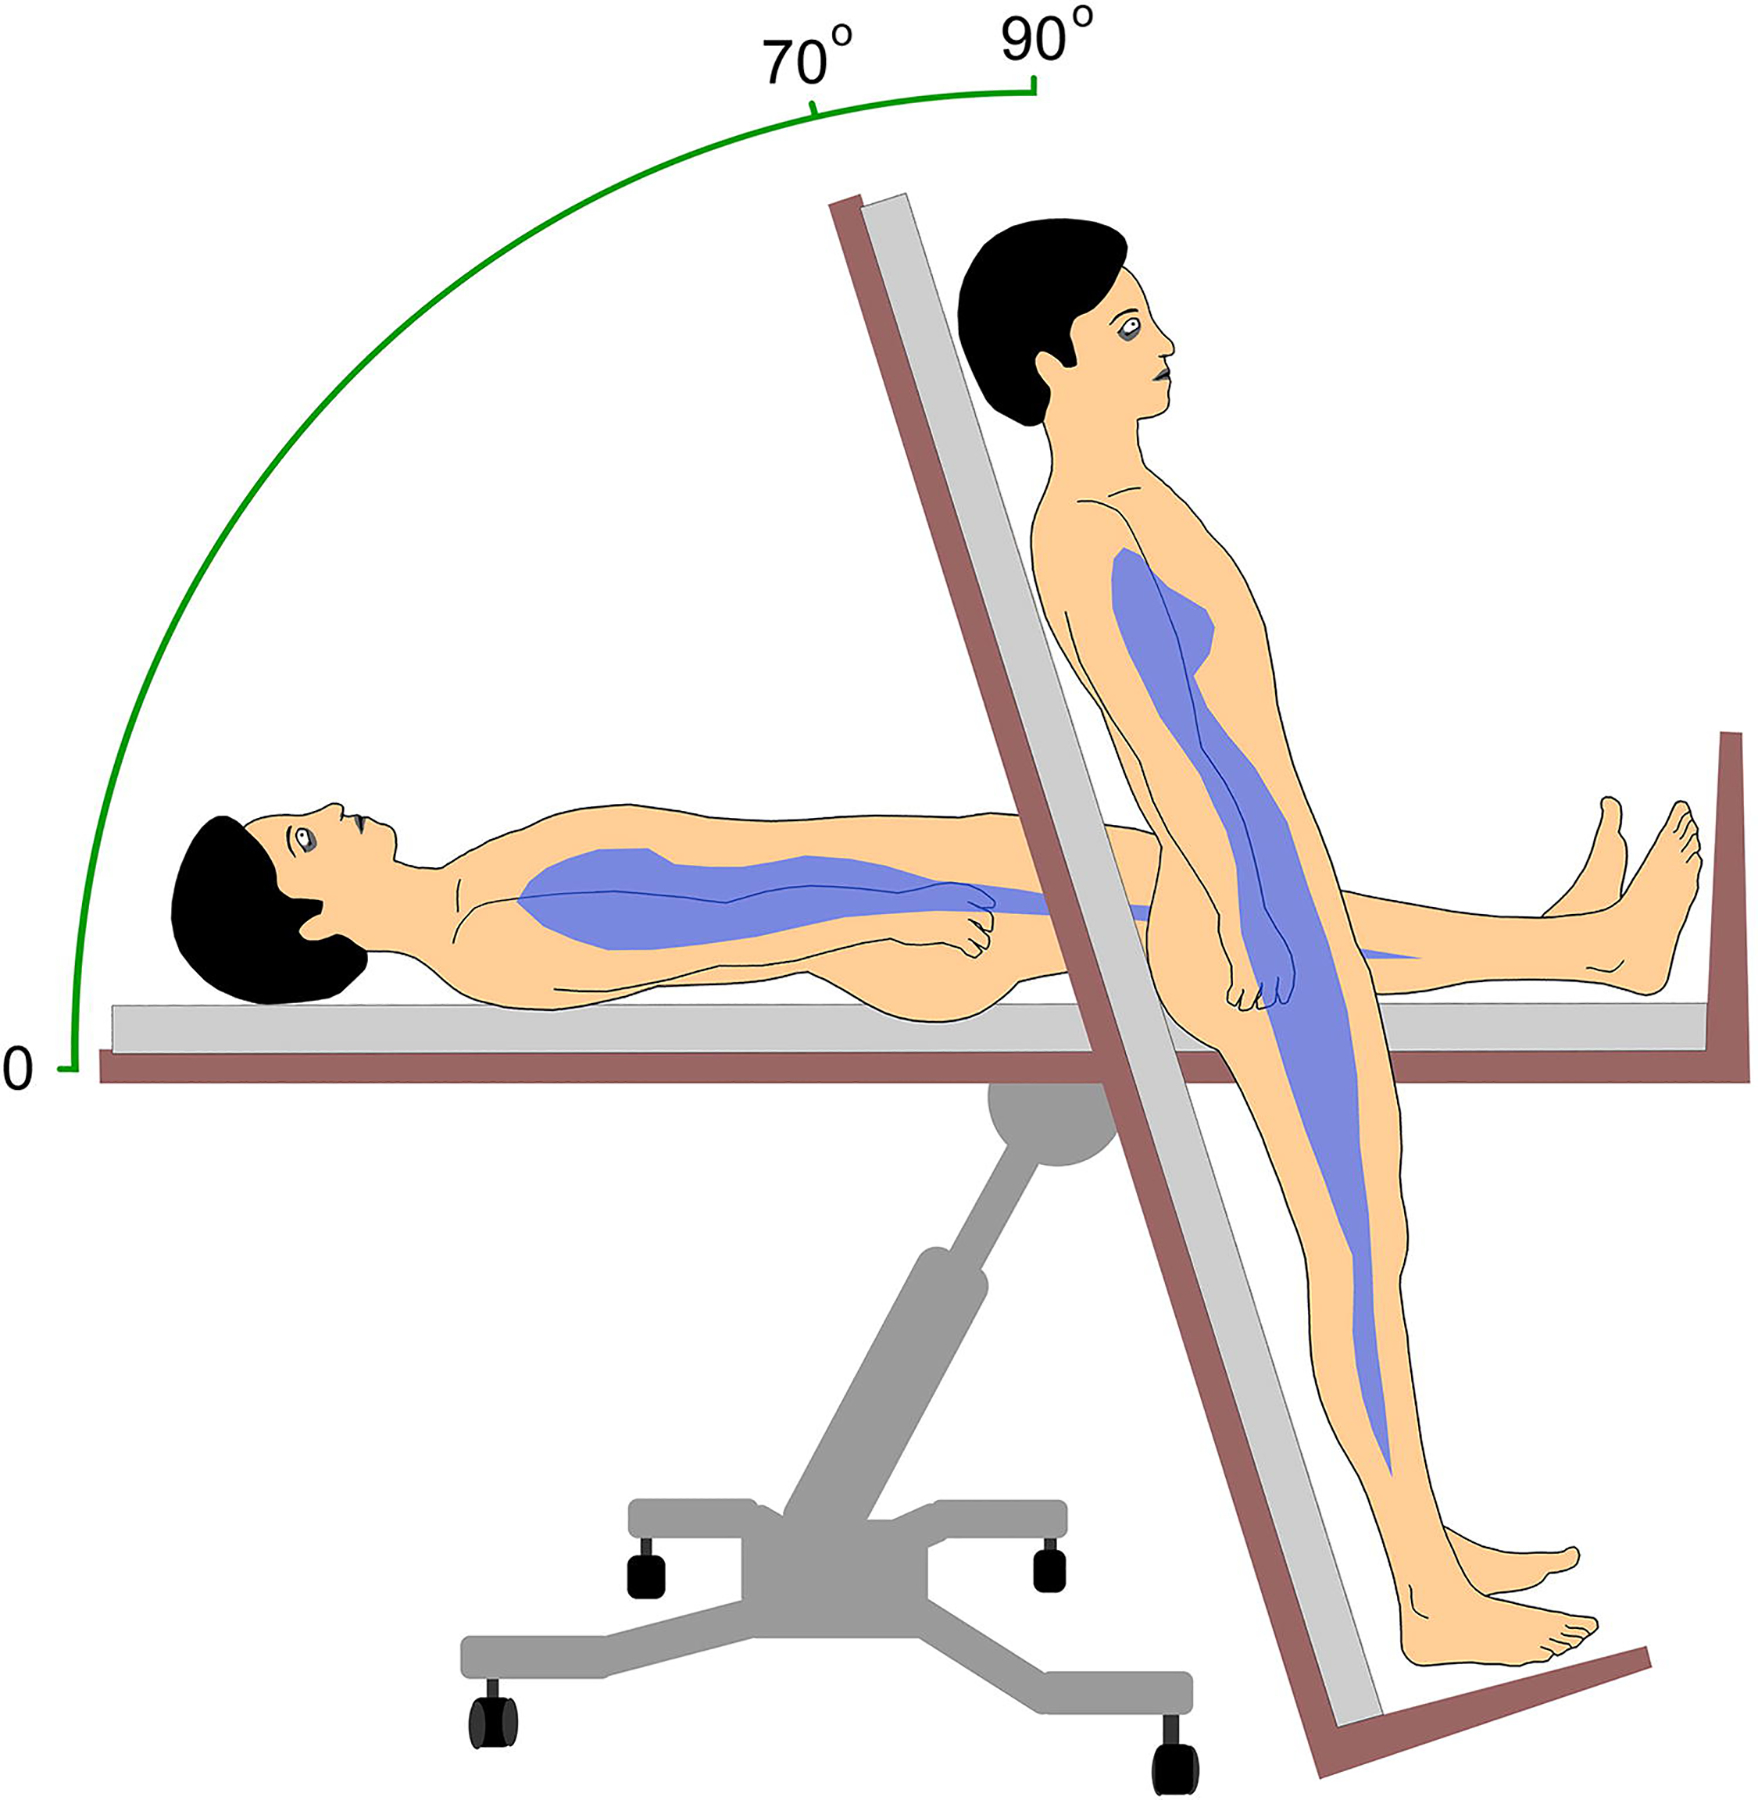
Figure 1.

Schematic diagram of the head-up tilt table test. The blue shape represents an approximation of the distribution of the central venous blood volume, which at a baseline angle of 0° is liberally present in the thorax. At at an angle of 70° the force of gravity shifts much of the thoracic venous blood volume downward into the pelvis and proximal lower extremities. A tilt angle of 70° results in a gravitational force of 0.94 G, which approximates the vertical angle but does fully engage the leg muscles to remain upright.
