
Figure 2. Distribution of Disaggregated Hispanic/Latino and Asian Subgroups in the United States, 2015-2019.
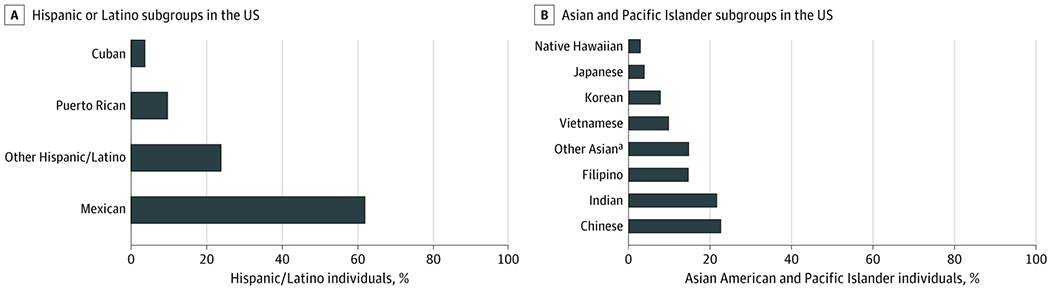
Hispanic/Latino and Asian individuals in the US represent a diverse, heterogeneous group of cultures that can and should be further disaggregated in census reporting, research studies, and interventions. Data are accessed from the American Community Survey 5-year estimates (2015-2019).30
aThe other Asian category includes individuals who self-reported as Asian ancestry other than Chinese, Indian, Filipino, Vietnamese, Korean, or Japanese.