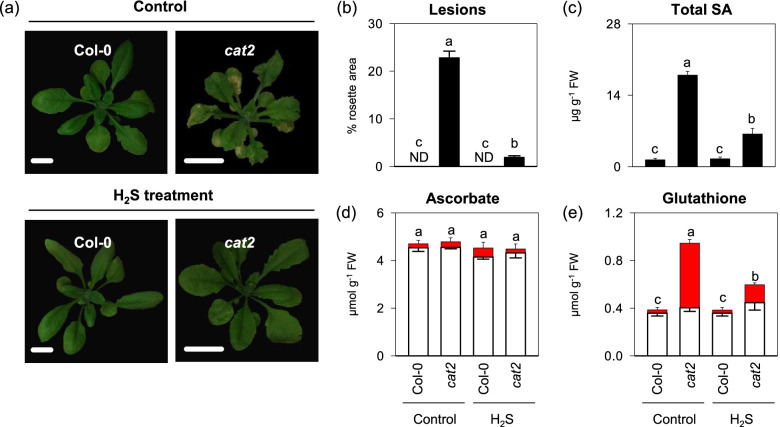
Fig. 4.
Effects of H2S exposure on phenotype, SA content and redox buffer in cat2 mutants. a representative image of twenty-day-old indicated genotypes. Scale Bars indicate 1 cm. b Lesion quantification in the different genotypes as a percentage of the total rosette area. ND, not detected. c Leaf total SA. d and e Leaf ascorbate and glutathione content. White bars, reduced form. Red bars, oxidized form. 16-day-old seedlings of Col-0 and cat2 were treated with gaseous H2S released from 0.5 mM NaHS solution under standard growth conditions for another 4 d. Values are means ± SE of three biological replicates. Different letters indicate significant differences at P < 0.05 by multiple pairwise t-test comparisons at P < 0.05

