
Figure 3.
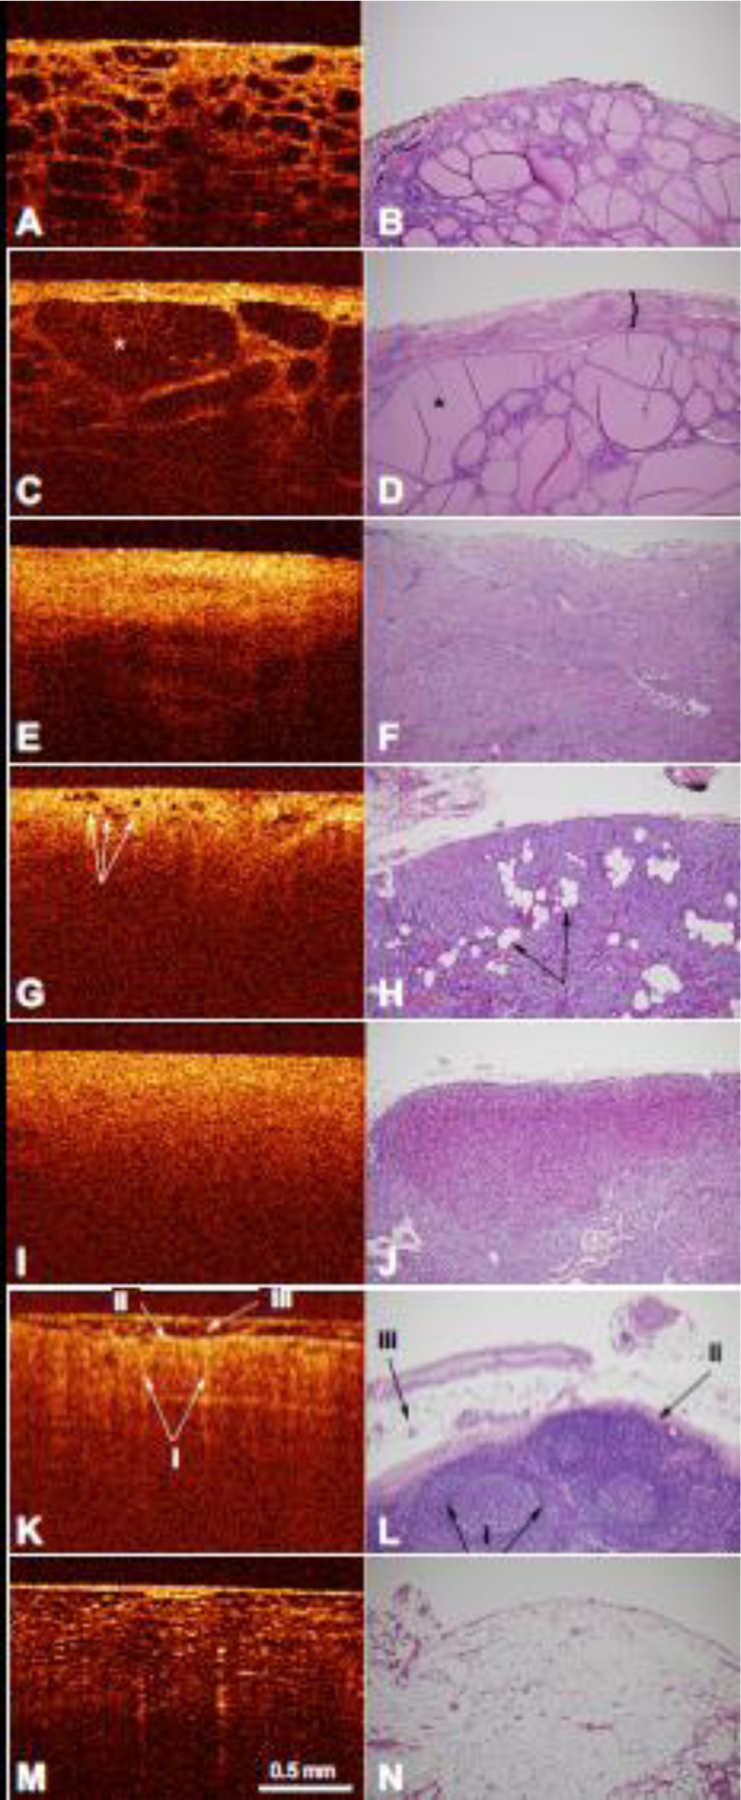
A) OCT image of normal thyroid tissue with the corresponding histology (B). C) OCT image of multinodular thyroid tissue with enlargement of the thyroid capsule (indicated by the bracket) and thyroid follicle (indicated by the asterisk). D) Corresponding histology of multinodular thyroid tissue with a fibrous capsule (indicated by the bracket) and multiple nodules of thyroid follicles of varying size (indicated by the asterisk). E) OCT image of thyroid cancer with the corresponding histology (F). G) OCT image of normal parathyroid tissue with normal fat within the parathyroid tissue (indicated by arrows) and the corresponding histology (H) with nests and cords of parathyroid cells and intervening stromal fat (indicated by arrows). I) OCT image of parathyroid adenoma tissue with the corresponding histology (J). K) OCT image of normal lymph node tissue demonstrating the follicles (i) capsule (ii), and fat on the external surface (iii). L) Corresponding histology of normal lymph node tissue also demonstrated follicles in the cortex, with a pale center and a dark rim (i), a fibrous capsule (ii), and surrounding adipose tissue (iii). M) OCT image of normal adipose tissue with the corresponding histology (N). OCT image scale bar is represented. Histology images are at 100x magnification.