. 2022 Jan 5;28(1):5–12. doi: 10.1158/1078-0432.CCR-21-1193

Figure 1.

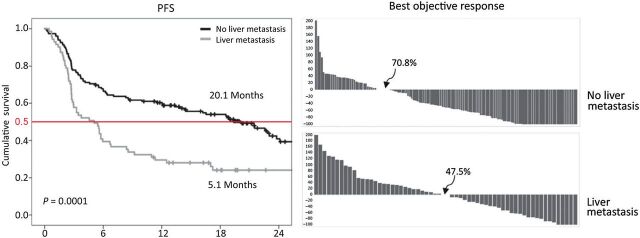
Figure 1. Kaplan–Meier OS curves for melanoma patients without (black line) and with liver metastasis (gray line) and waterfall response curves for melanoma without and with liver metastasis. All patients were treated with pembrolizumab immunotherapy as described in Tumeh and colleagues (32). Figure originally published in Cancer Immunology Research (32).

Kaplan–Meier OS curves for melanoma patients without (black line) and with liver metastasis (gray line) and waterfall response curves for melanoma without and with liver metastasis. All patients were treated with pembrolizumab immunotherapy as described in Tumeh and colleagues (32). Figure originally published in Cancer Immunology Research (32).