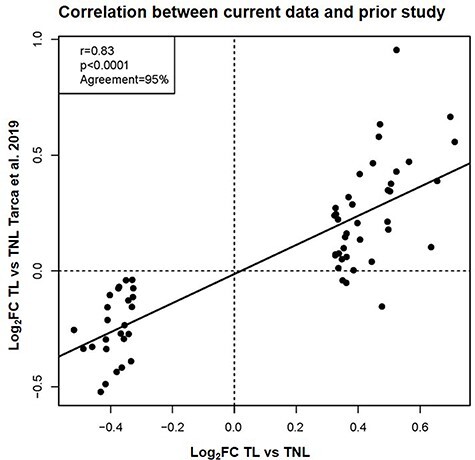
Figure 2.

Correlation between labor-specific gene expression in the peripheral blood from the current study and a previous report. Scatterplot showing the correlation between the log2FC reported in this study and that from a previous report [56]. The Pearson correlation coefficient, p-value, and percentage of agreement on direction of gene expression FC are shown.
