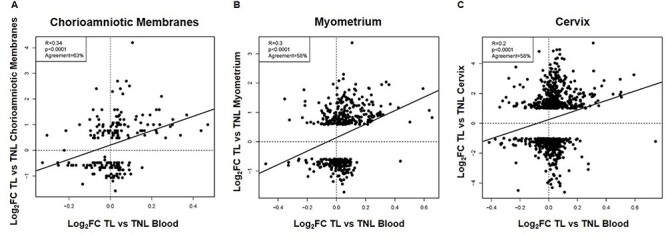
Figure 3.

Correlation between labor-specific gene expression in the peripheral blood and that in the chorioamniotic membranes, myometrium, or cervix. Scatterplots showing the correlation between gene expression (log2FC) reported in this study and that in (A) the chorioamniotic membranes [59], (B) the myometrium [60], or (C) the cervix [61]. The Pearson correlation coefficients, p-values, and percentages of agreement on direction of gene expression FC are shown for each comparison.
