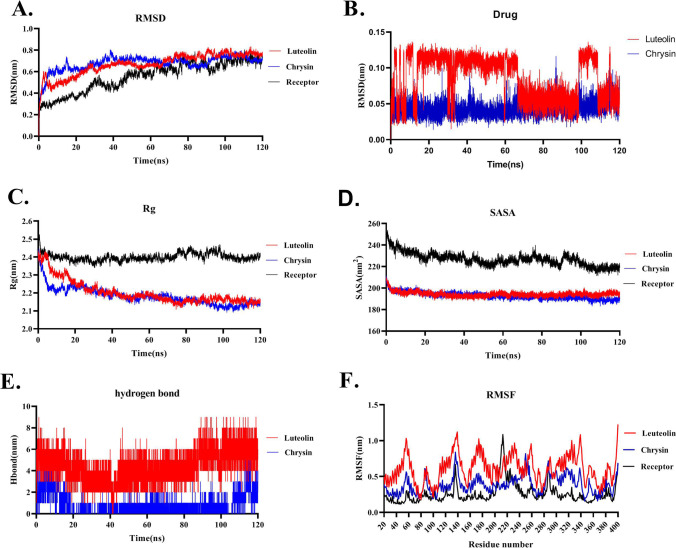
Fig. 4.
Molecular Dynamics simulation analysis of Luteolin and Chrysin throughout the interaction with ACE2 receptor during 120 ns of the simulation. A RMSD plots represent that Luteolin-ACE2 and Chrysin-ACE2 reach a steady-state during 120 ns of simulation with the RMSD around 0.7 nm. Free ACE2 is defined as the receptor in the RMSD plot. B RMSD plots of Luteolin and Chrysin during 120 ns of simulation. C Rg plot indicates that Luteolin-ACE2 and Chrysin-ACE2 have the Rg values of around 2.1 which is less than the Rg value of 2.4 for the free form of ACE2 (defined as the receptor in the plot). D SASA plot presents that Luteolin-ACE2 and Chrysin-ACE2 have similar SASA values which are less than the free form of the ACE2. E Hydrogen bond plot figures out that Luteolin-ACE2 has a higher number of hydrogen bonds than Chrysin. F RMSF plot demonstrating that Luteolin has higher RMSF fluctuation than Chrysin and the free form of ACE2 (defined as the receptor in the plot)

