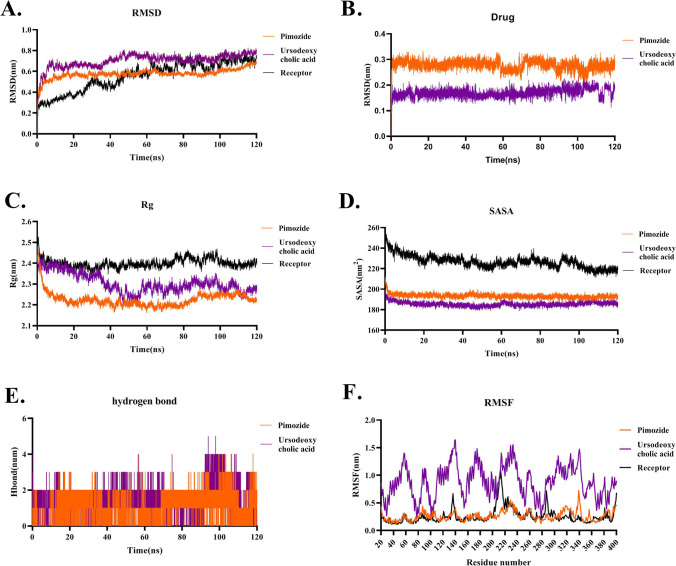
Fig. 7.
Molecular dynamics simulation of Pimozide and Ursodeoxycholic acid throughout the interaction with the ACE2 receptor during 120 ns of the simulation. A RMSD plot of Pimozide and Ursodeoxycholic acid shows that both drugs have the same RMSD value to the free form of ACE2. Besides, both drugs represent a slight fluctuation around 100 ns of the simulation. B RMSD plot of Pimozide and Ursodeoxycholic acid during simulation. Data shows that Ursodeoxycholic acid has less RMSD value than Pimozide. C Rg plot of Pimozide and Ursodeoxycholic acid showing lower Rg value than the free form of ACE2 which indicates both drugs caused a more relax and compact structure compared to the free form of ACE2. D SASA plot of Pimozide and Ursodeoxycholic acid illustrates that both drugs make surface structure changes in ACE2 compared to the free form of ACE2. E Hydrogen bond plot of Pimozide and Ursodeoxycholic acid shows that both drugs have the same hydrogen bond. F RMSF plot of Pimozide and Ursodeoxycholic acid indicates that Ursodeoxycholic acid has more fluctuation than Pimozide and the free form of ACE2. Also, Pimozide shows the same fluctuation compared to the free form of ACE2

