
Figure 1.
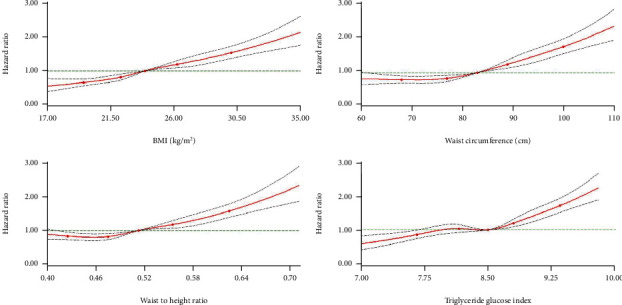
Hazard ratios for the association between four indicators (body mass index, waist circumference, waist to height ratio, and f triglyceride glucose index) and T2DM risk. The circles represent the points (5, 25, 50, 75, and 95 percentiles) where the nodes were placed. The region between the two dotted lines represents the 95% confidence intervals. The model was adjusted for age, gender, marital status, smoking, drinking, physical activity, RHR, RHR, SBP, DBP, and TC levels. Values were trimmed at less than 1st percentile and greater than 99th percentile of each indicator. SBP: systolic blood pressure; DBP: diastolic blood pressure; RHR: resting heart rate; TC: total cholesterol; BMI: body mass index; WC: waist circumference.