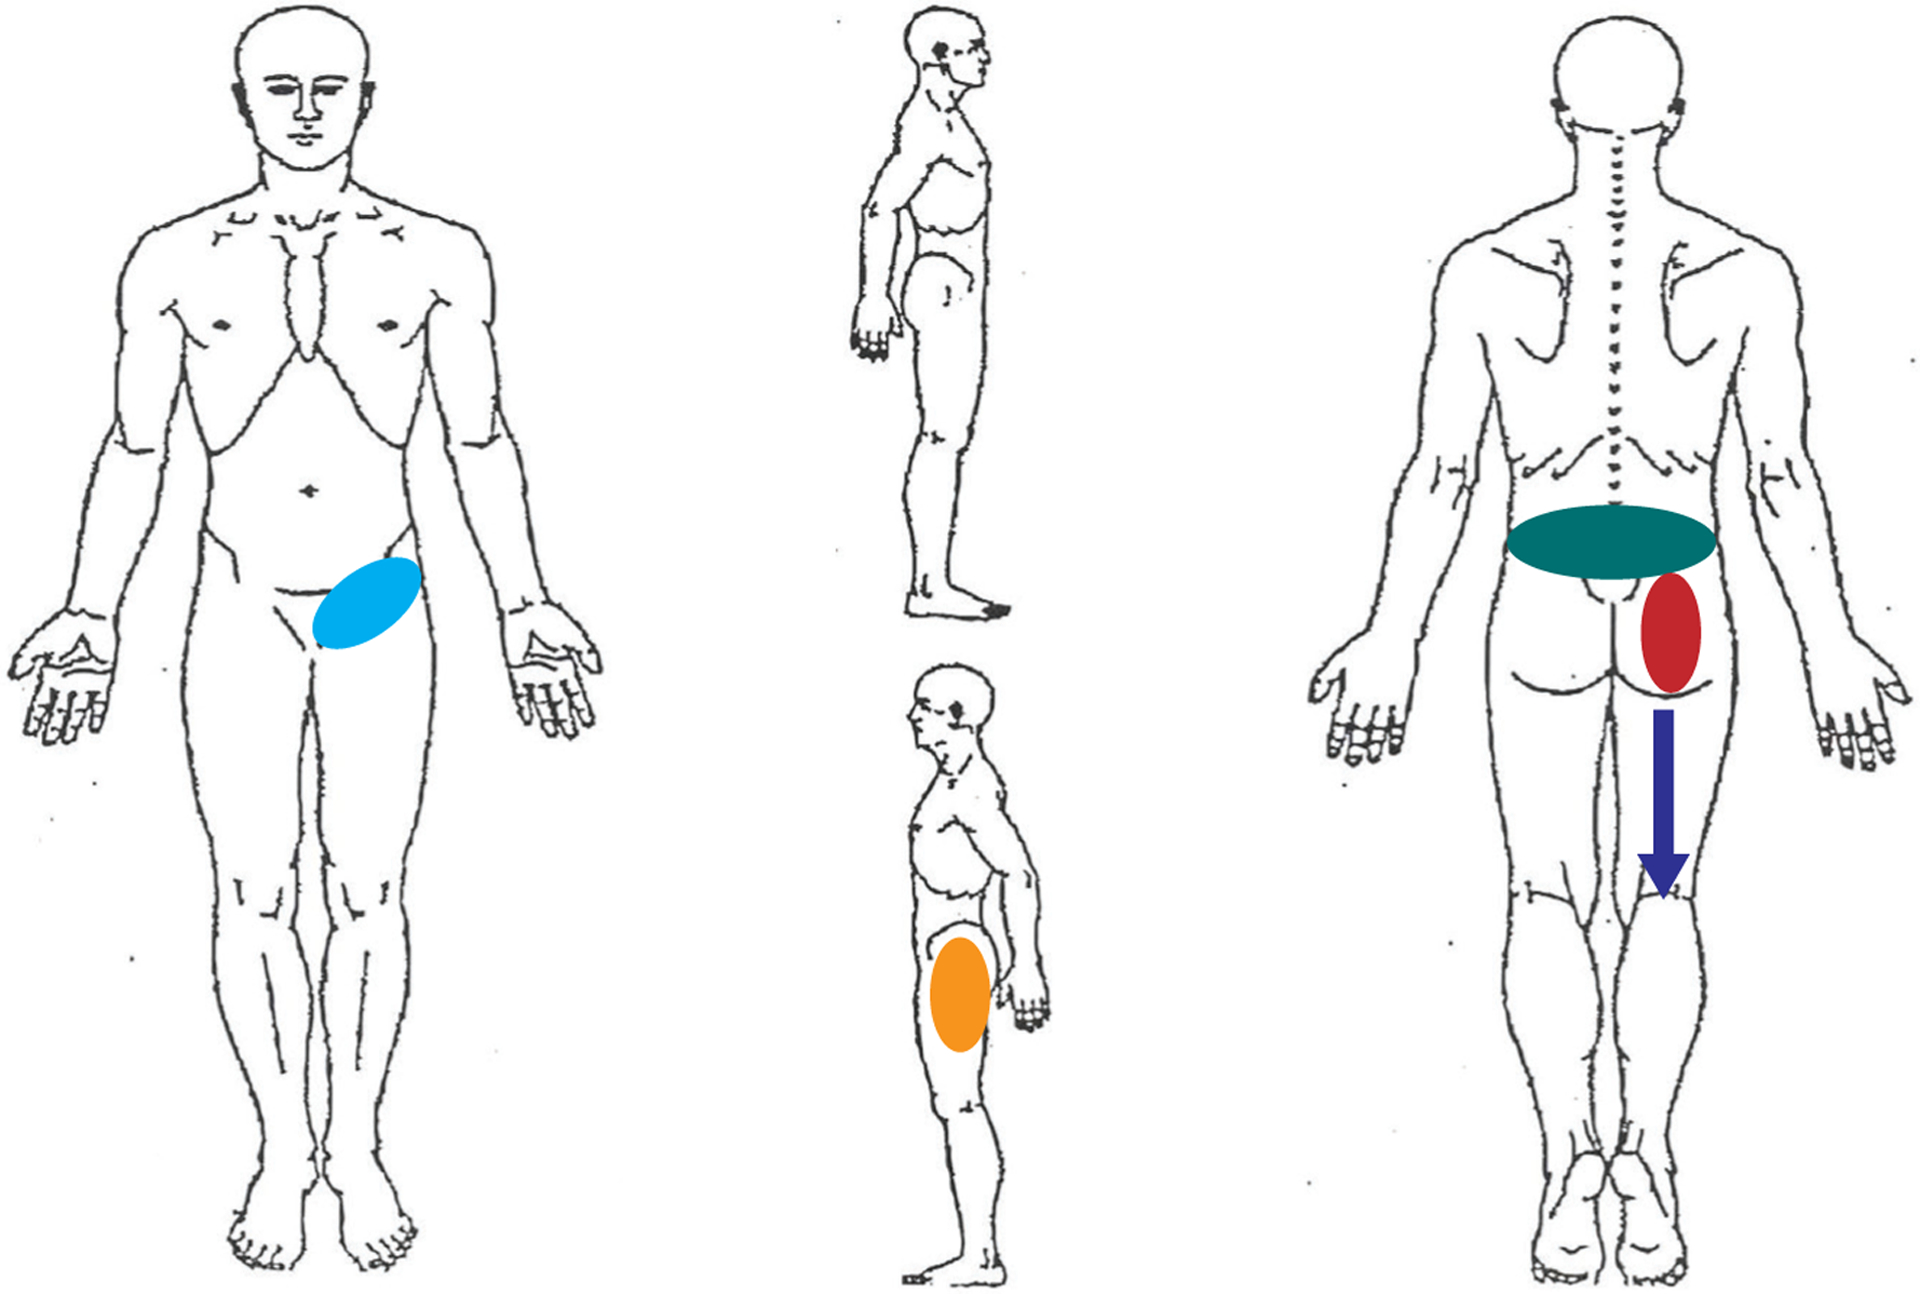
FIGURE.

Distribution of pain, self-reported by the patient. The percentages listed denote the percentage of patients who marked this area to be painful. Light blue: groin, n = 35 of 101 (35%). Orange: lateral hip, n = 50 of 101 (50%). Green: L5 and superior, n = 100 of 101 (99%). Red: distal to L5 and proximal to the gluteal fold, n = 67 of 101 (66%). Dark blue: below the gluteal fold, n = 71 of 101 (70%).
