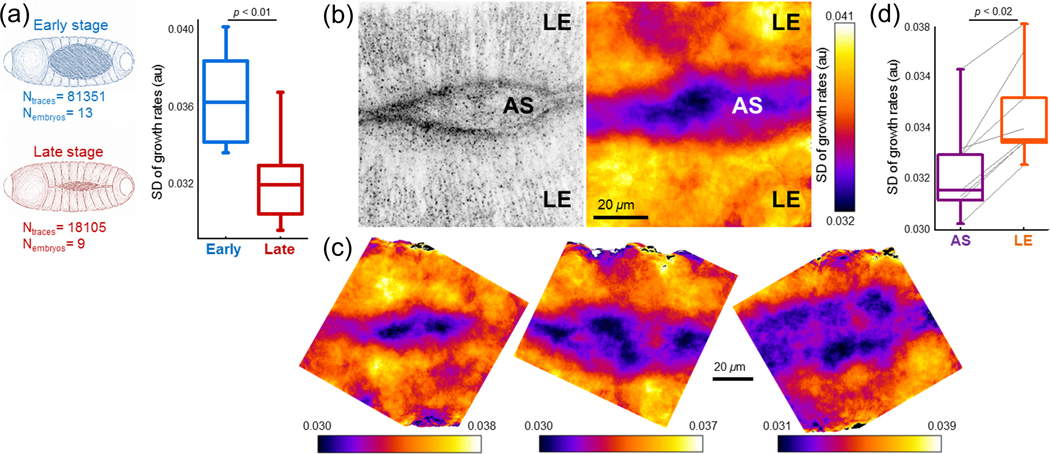
Figure 4 |. Spatiotemporal variations in CME dynamics during Drosophila embryogenesis.
(a) Changes in CME dynamics at the amnioserosa tissues during the dorsal closure of embryos. Box plots show SD of growth rate distributions obtained from amnioserosa tissues at early and late stages of the dorsal closure. CME dynamics slow down with increasing tension In the tissue, (b) Left, clathrin-coated structures at the dorsal surface of a Drosophila embryo. Right, SD map determined using clathrin growth rates obtained at the amnioserosa (AS) and the lateral epidermis (LE) tissues. Lower values of the SD demonstrate slower CME dynamics at the AS tissue, (c) More examples demonstrating the spatial heterogeneity of CME dynamics at the dorsal surface of late stage Drosophila embryos, (d) Box plots showing SD of growth rates obtained from lateral epidermis and amnioserosa tissues. Reproduced, with permission, from Willy et al. (2017).

