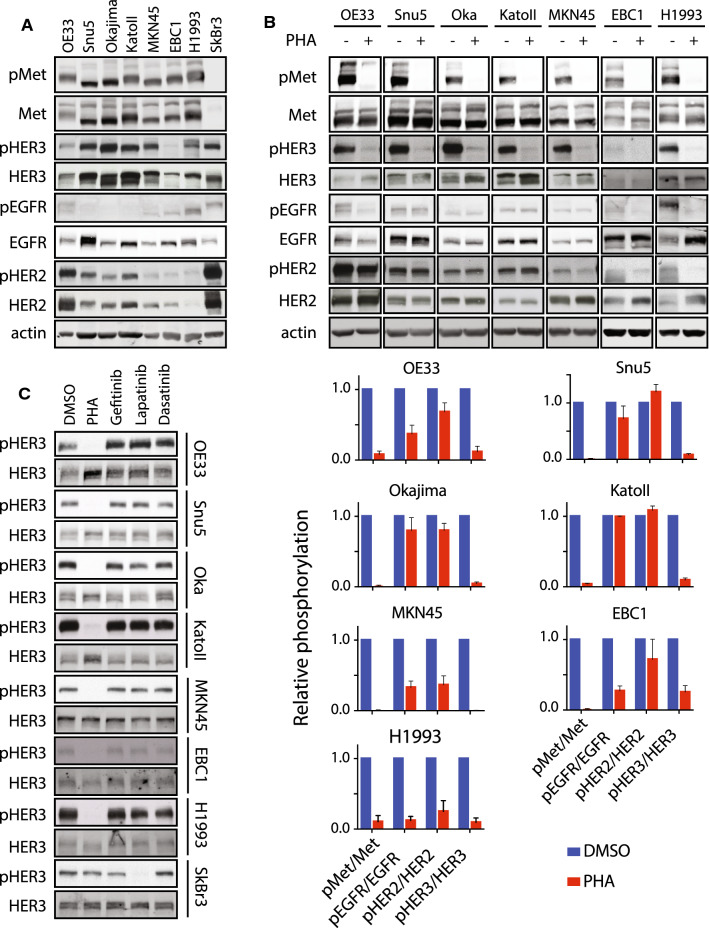
Fig. 1.
MET-amplified cancer cells display Met–EGFR family crosstalk with preference for HER3. a Western blot analysis of the phosphorylation of Met (Tyr1234/45), EGFR (Tyr1173), HER2 (Tyr1221/22) and HER3 (Tyr1289) in seven MET-amplified cancer cell lines and the ERBB2-amplified cell line SkBr3. b Western blot analysis of the phosphorylation of Met (Tyr1234/45), EGFR (Tyr1173), HER2 (Tyr1221/22) and HER3 (Tyr1289) in the indicated cell lines treated with PHA-665752 (PHA) (0.5 μM, 1 h) or DMSO. Histogram shows quantification of phosphorylated RTK in treated vs. control conditions, normalized to total protein (lower panel, n = 3). c Western blot analysis of the phosphorylation of HER3 (Tyr1289) in the indicated cell lines treated with PHA (0.5 μM); the EGFR inhibitor, gefitinib (1 μM); the HER2/EGFR inhibitor lapatinib (1 μM); or the Src and Abl family kinase inhibitor, dasatinib (0.1 μM), for 1 h (n = 3). Error bars indicate SEM

