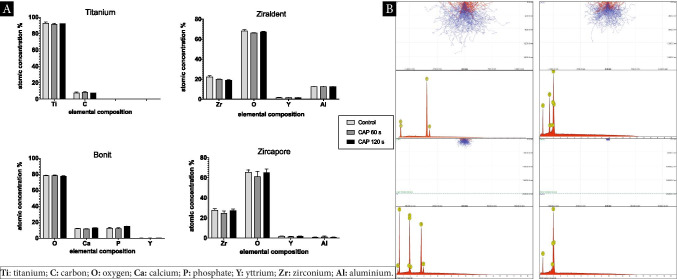
Fig. 4.
EDS elemental analysis using Phenom Element Identification software 3.8.4.0. A Quantitative EDS analysis for CAP application identifying shifts of the atomic concentration for implant materials. Influences on the elemental composition using application times of 60 s/120 s. B Monte-Carlo simulation for EDS spectra and electron profiles of different implant surfaces/blue dotted line indicating the coating layer of titanium (Bonit®) and superficial layer of zirconia (Zircapore®) specimens. All the statistical significance values were declared as p < 0.05

