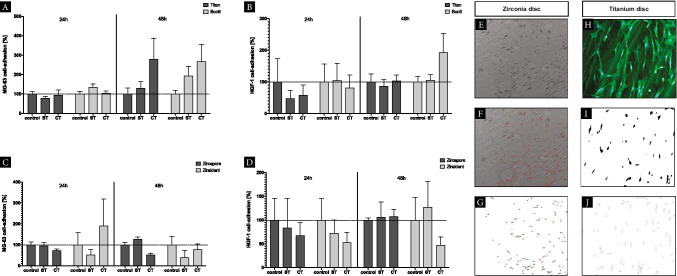
Fig. 7.
CAP adhesion assay. A–D Adjusted percentage of cell adhesion after (24 h/48 h) of different CAP treatment modalities. Untreated specimens/cells served as control, surface treatment (ST), cell treatment (CT); columns and error bars represent the mean ± SEM (n = 3). E/H Cell quantification using ImageJ Software, microscopic detection of cell colony within the area of interest (AI) (× 50). F/I Image transformation for cell detection using 8-bit resolution (Process: Binary: Make Binary) with cell separation G/J automatic cell counting (Menu: Analyse Particles) narrowing particle size (Size: 25-Infinity/Circularity: 0.00–1.00)

