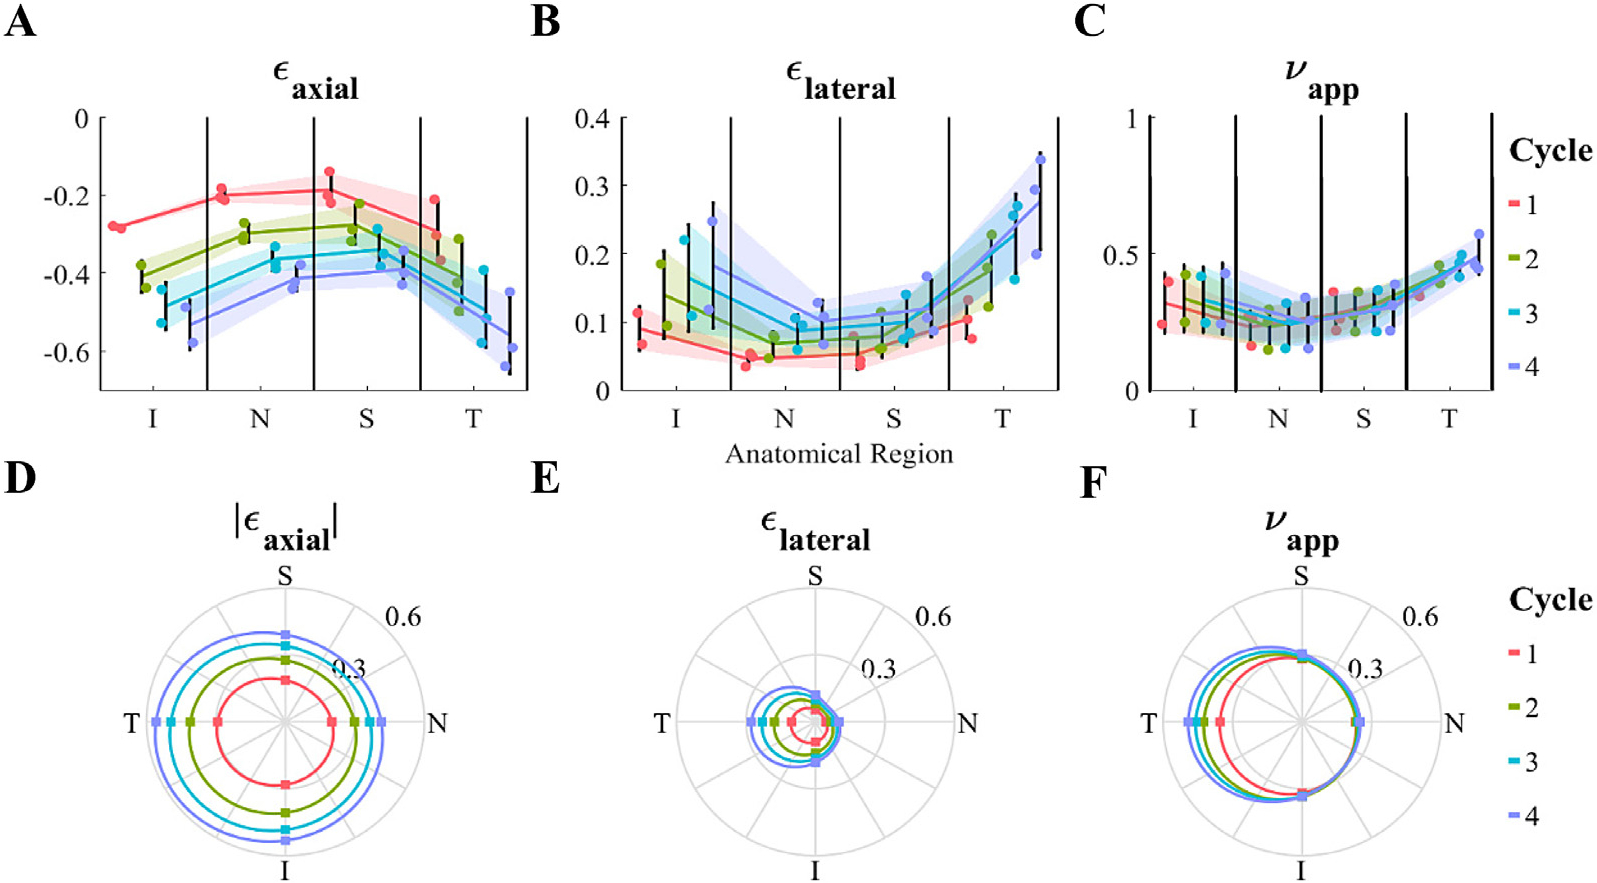
Fig. 2.

Regional dependence (analysis of variance) of (A and D) axial strain [∈axial], (B and E) lateral strain [∈lateral], and (C and F) apparent Poisson’s ratio [νapp]. For each parameter, the first row (A-C) shows the individual data points, their means ± standard deviation (shaded region) for each anatomical region and cycle number, and the second row (D-F) illustrates the mean values (dots) in a polar plot matching the anatomical orientations, where 0, 90, 180 and 270 degrees correspond to nasal [N], superior [S], temporal [T], and inferior [I], respectively. Each of ∈axial, ∈lateral and νapp were dependent on anatomical region, with the temporal and inferior quadrants being more compliant than the nasal and superior quadrants. The cycle number significantly impacted ∈axial and ∈lateral; however, it did not affect νapp. There was no interaction between the anatomical region and cycle number, i.e. heterogeneity was not affected by loading level.
