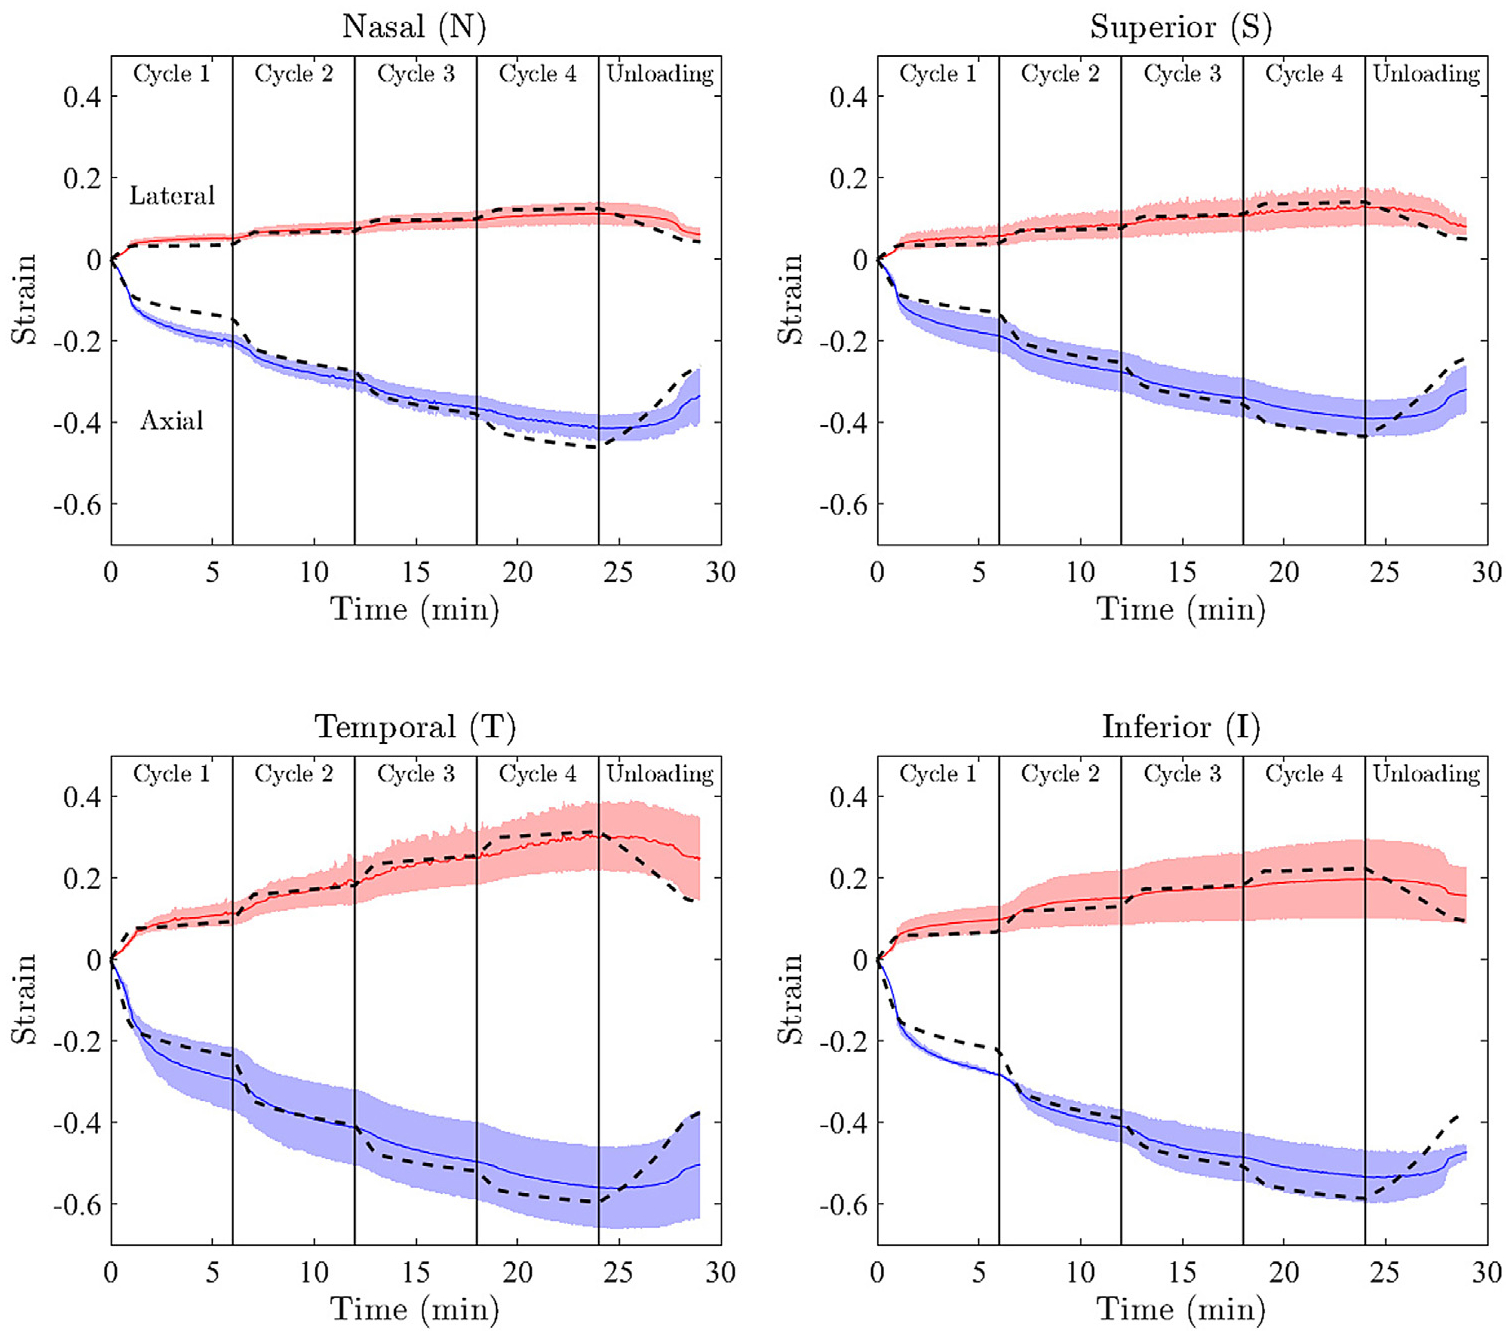
Fig. 3.

Results of data-fitting for each of the anatomical quadrants. The means ± standard deviation of the ex vivo experimental data are shown with solid lines and shading, respectively. Positive strains correspond to the lateral direction, while negative values are axial strains. For each region, the model response generated using the median of accepted fits is shown by the dashed lines. Note the good agreement between experimental (solid lines) and fitted (dashed lines) strains.
