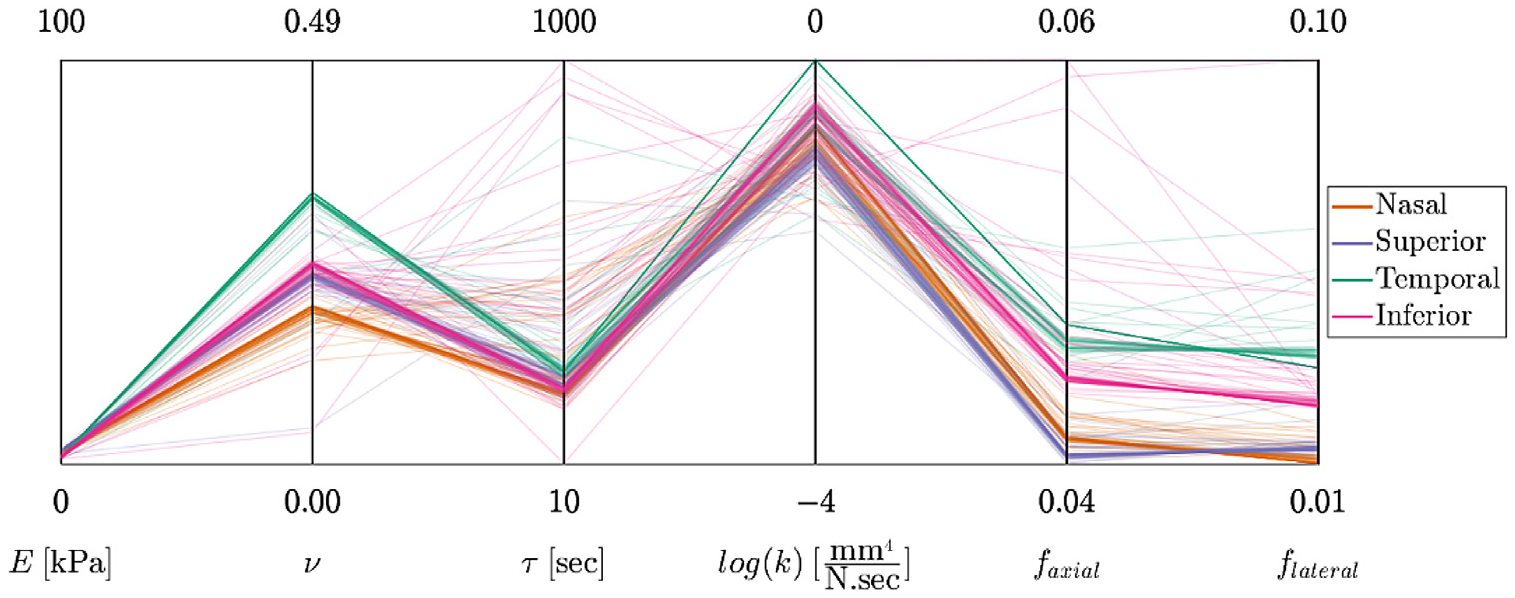
Fig. 4.

The data-fitting results shown in parallel coordinates format. The four coordinates on the left are the model parameters (E, ν, τ, k). For each model parameter, the graphed range of the coordinate corresponds to the prescribed range of model parameter values. The two additional coordinates are the RMSE of the fits in the axial and lateral direction (i.e., faxial and flateral).
