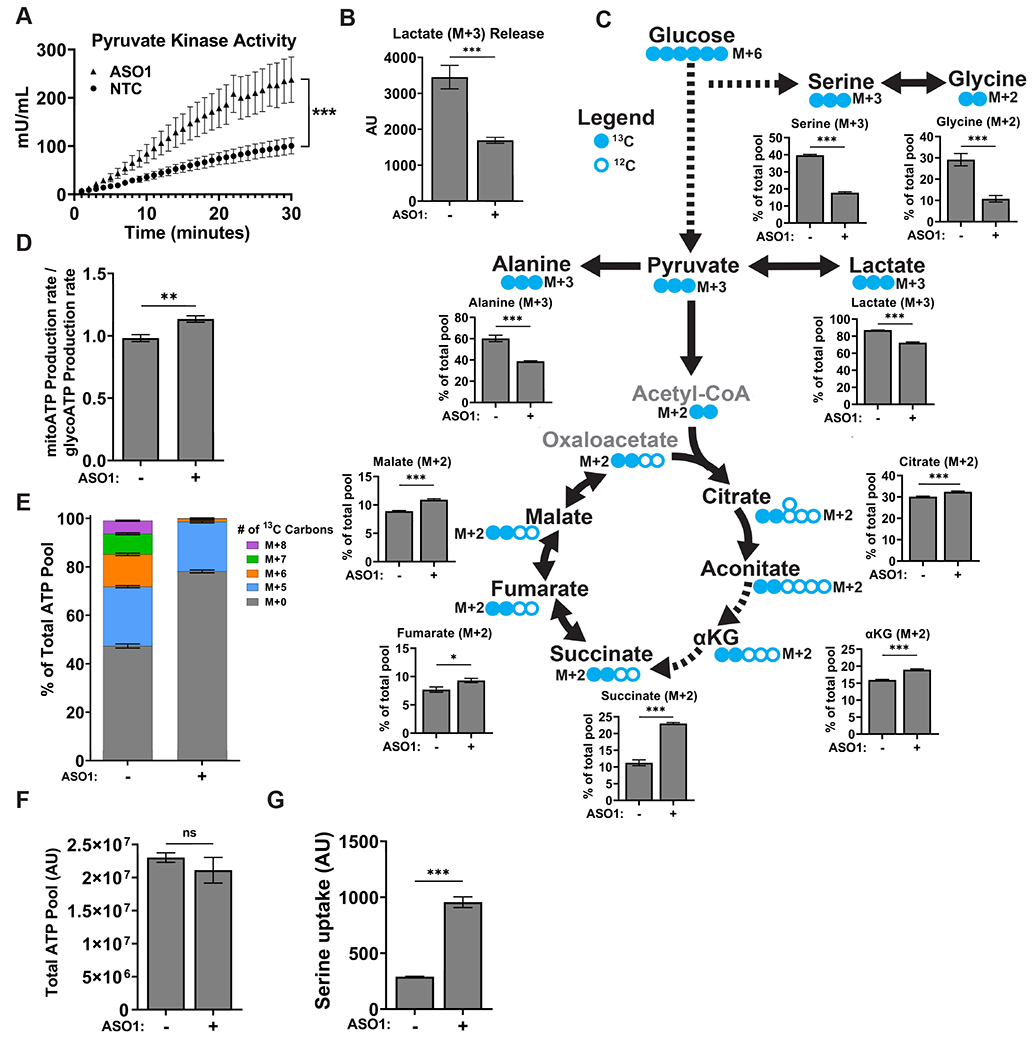
Figure 4. ASO1-cEt/DNA stimulates pyruvate kinase activity and alters glucose metabolism.

(A) Pyruvate kinase activity increases upon ASO1-cEt/DNA treatment. Pyruvate kinase assay was performed after treating Huh7 cells with 20 μM ASO by free uptake for 4 days. Pyruvate kinase (PK) activity was normalized to 5×10⁴ cells. The graph represents the average of three independent biological replicates ± SEM. (B) Levels of lactate released to the medium were measured in Huh7 cells treated with 20 μM ASO by free uptake for 7 days. The medium and ASO were replenished on day 4. LC-MS was conducted on extracted metabolites from the medium after incubating Huh7 cells in medium with [U-13C] glucose for 8 hours on day 7. The levels of lactate release were normalized to the number of cells. (C) ASO1-cEt/DNA alters glucose metabolism. Huh7 cells were treated and processed for LC-MS as in panel (B). Various 13C-containing metabolites are shown, along with their representative isotopologue percentages. (D) ASO1-cEt/DNA increases mitochondrial ATP production rate. Seahorse extracellular flux analysis showing the ratio of mitochondrial ATP production rate (mitoATP) to glycolytic ATP production rate (glycoATP) in Huh7 cells treated with ASO as in panel (B). Production rate refers to pmol ATP/min/103 cells. (E) Detected isotopologues of labeled ATP from [U-13C]-glucose in Huh7 cells treated and processed as in panel (B). (F) Total amount of intracellular ATP detected in Huh7 cells treated and processed as in panel (B), normalized to number of cells. (G) Detected levels of extracellular serine consumed by Huh7 cells processed as in panel (B). Data in panel (B, C, E, F, and G) are the average of 5 independent cultures ± SEM. Data in panel F are the average of 6 independent cultures ± SEM. A linear mixed-effects model was used to determine significance in panel (A). Two-tailed, unpaired t-test was performed in panels (B, C, D, F, and G). * P ≤ 0.05; ** P ≤ 0.01; *** P ≤ 0.001.
