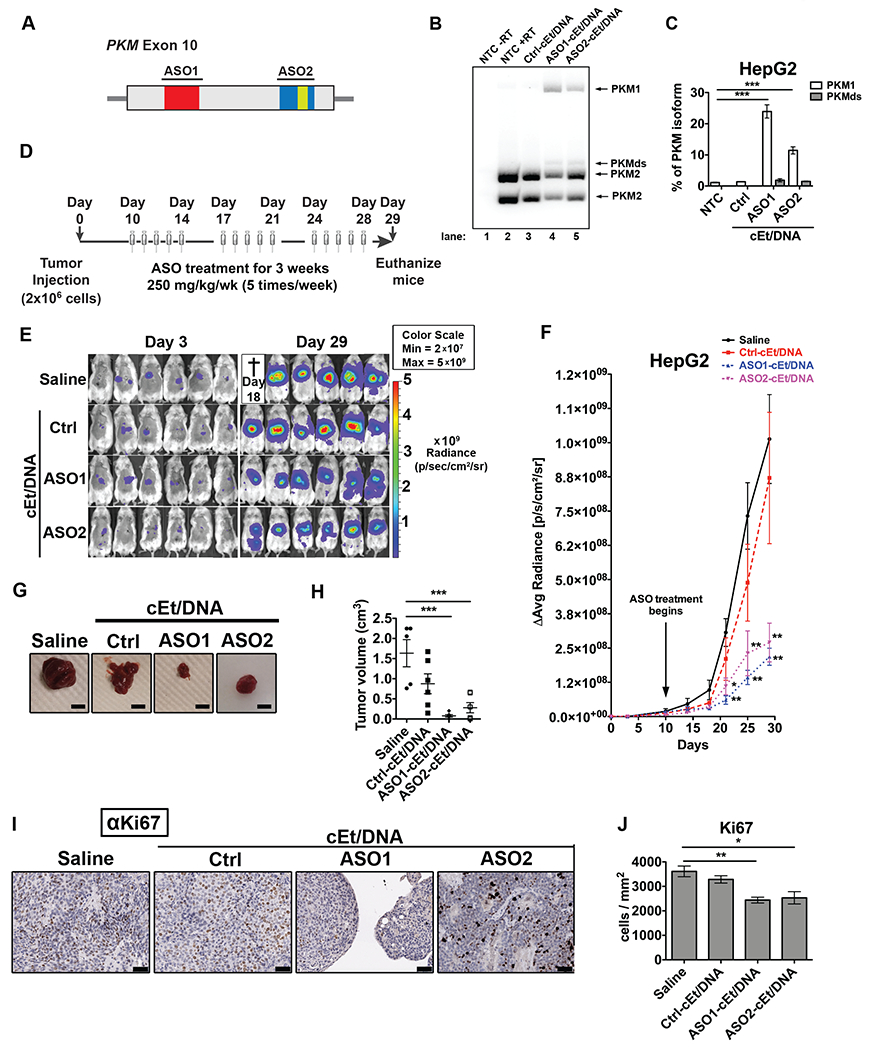
Figure 5. ASO1-cEt/DNA and ASO2-cEt/DNA inhibit HepG2 cell growth in a xenograft model.

(A) Diagram of ASO1-cEt/DNA- and ASO2-cEt/DNA-targeted regions. ASO1-cEt/DNA and ASO2-cET/DNA each target regions (red and blue, respectively) we previously identified (19). ASO2-cEt/DNA also targets a known SRSF3 binding site (yellow)(50). (B) ASO1-cEt/DNA has higher potency than ASO2-cEt/DNA to switch PKM switching in HepG2 cells. Radioactive RT-PCR analysis of RNA from HepG2 cells transfected with 60 nM ASO. (C) Quantification of PKM1 and PKMds isoforms in panel (B). (D) Schematic of ASO dosing schedule in the HepG2 xenograft mouse model. 2×10⁶ HepG2 cells were transplanted on day 0 and allowed to grow for 10 days prior to the first ASO treatment. ASOs (250 mg/kg/wk) were delivered subcutaneously with a weekly schedule of 5-consecutive-day injections, followed by 2 days without injection, for 3 weeks. (E) Whole-animal live imaging of mice with luciferase-integrated HepG2 cells that were orthotopically transplanted in the liver. Luminescence images of transplanted mice on day 3 and day 29 are shown with a color scale from 2×10⁷ (min) – 5×10⁹ (max). A total of 24 mice (N=6 per group) were randomized to each treatment group; one saline-treated mouse died on day 18. (F) Quantification of luciferase signal in panel (E). The average of 5or 6 biological replicates ± SEM is shown. (G) Representative pictures of tumors on day 29. Scale bar = 5 mm. (H) Quantification of tumor volume on day 29. (I) Representative IHC images of Ki67 expression in liver sections with tumors on day 29. Scale bar indicates 50 μm. (J) Quantification of Ki67-positive cells in panel (F). Data in panels (B, C, F, H, and J) are the average of three biological replicates ± SEM. One-way ANOVA was performed with Dunnett’s multiple comparison post-hoc test. * P ≤ 0.05; ** P ≤ 0.01; *** P ≤ 0.001.
